
In this post, Don Miner covers how to identify, evaluate, prioritize, and pick which data science problems to work on next.
Three Phases for Assessing Data Science Use Cases
Planning which data science use cases to work on next isn’t much different from deciding which use cases to work on next in other realms. You need to understand your overall business strategy and objectives before planning any use cases. Yet, it is incredibly important to do thoughtful planning in data science because data science brings its own unique challenges that the business world is still struggling to fit into their existing processes. These challenges mostly stem from high risk, indeterminable effort requirements, and multiple potential outcomes. In this post, I’ll share some thoughts on how to decide which data science use cases to work on first, or next, based on what has been successful for me as a data science consultant helping companies, from Fortune 500s to startups. I like to separate the use case evaluation and selection process into three phases to make it a bit more manageable. The three phases I’ll be talking in more depth about in this post are:
- List out your potential use cases
- Evaluate each use case
- Prioritize your use cases
This process I’ll be describing in this post is designed to be able to be flexible enough to be taken to whatever situation you and your business are in. After you list, evaluate, and prioritize your use cases, you’ll be able to plot them. The entire process is aimed to help you make your decisions, but also share them in a way to effectively level-set with the rest of your organization.
Plotting Use Cases: Risk vs. Level of Effort
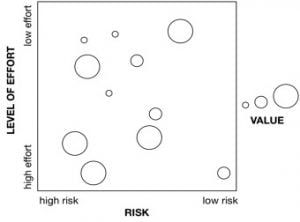
My approach pulls from a planning approach that might be familiar to some. It uses a square chart that plots use cases’ risk versus their level of effort and uses the size of the bubble as the value. In general, use cases you want to do are in the top right and are large bubbles. Unfortunately for us, usually the highest value targets are high effort and high risk, so it’s a matter of deciding how much effort you can put into something, what your tolerance for risk is, and how much value you need today.
Getting from a list of use cases to this chart for data science is a bit more challenging than it may seem at first, and that’s what this article is about. First, I’ll talk about building a good list of use cases, then I’ll talk about how to measure effort, value, and risk for each, and then all that’s left is making our plot!
Listing out Your Potential Use Cases
What is a data science use case? Usually it’s a hypothesis or a question. Sometimes it’s looking for an answer, sometimes an explanation, or sometimes it’s just validation that something is real. At the end of the day, it has to do with a question that could be answered by using data.
Listing out potential use cases is deceptively easy for data science. Everyone has a lot of ideas, but there are two sources of bias that will cause them to leave good ideas behind.
- Bias towards things they personally know about.Nobody has complete visibility into the whole organization, especially when it comes to data. There is just too much data for everyone to know everything about.
- Bias towards things people think are too hard or impossible. New technologies and approaches in data science have fundamentally shifted what questions can be answered, but people have been trained by their DBAs that some questions shall not be asked. The whole reason data science is gaining in popularity is because of a new series of technologies and techniques which have opened up ways to solve problems that have previously been impossible-- so let’s take advantage of that.
Acknowledging this bias is really all that needs to be done to overcome it, but I do see it time and time again with organizations just beginning with data science. Building a healthy list will help put everything on the table, get everyone on the same page, and will let you compare and contrast the value, risk, and level of effort for multiple different kinds of use cases.
The best way to overcome these biases is collaborative communication between everyone: data scientists, DBAs of the legacy systems, lines of business owners, and end users.
Each role brings a unique view into the picture. If you leave listing out use cases to any one role, you’ll probably leave something good behind. The DBAs probably have a good sense of “unsolved problems” that have been computationally impossible, like a massive join between two data sets, or “just not a good fit” to database technologies, like natural language processing use cases. Lines of business and end users will have a sense of what’s important, but will need encouragement from data scientists to confirm that what they want is possible. End users might have been conditioned that asking for a certain type of query is impossible from their DBAs, but the data scientists can now say “yes”.
I’ve found the best approach is to just get everyone in a room for an hour and write as many use cases on a whiteboard as possible! At the end of this exercise you should have a name for each use case and a short description of what the use case is about.
Evaluating Use Cases
For each use case, we’ll want to get a good sense of three aspects: value, level of effort, and risk. Each use case is going to have a different mix of these. Evaluating use cases in data science is hard for organizations at first. The main reason is people think about data science projects as software or IT projects, not as its own unique thing. As soon as someone starts building “data science stories” into JIRA I try to get them to stop. Data science projects are not software or IT.
Data Science Projects vs. Software Engineering Projects
In software engineering, you have an idea, you have a pretty good idea of what you want to build, you know how to build it, and you take a guess at how long it'll take. It is still hard, but there is a clear end to the project and a clear path on how to get there. Software projects are notorious for being over budget and late, but data science can be worse if not taken seriously.
In data science you can work on a single use case for as long as you want. If you work, “not long enough” on it, your results will be bad. If you work on it “too long”, you start getting diminishing returns and the output isn’t worth the effort. Planning data science is more about putting forth the appropriate amount of effort and doing the best that can be done in a specific time frame, rather than reaching some sort of goal.
At the end of this phase of the exercise, you’ll be assigning a value score to each use case, an order of magnitude of effort to each use case, and a percentage chance of something bad happening for risk for each use case. These will give you the values needed to build the chart I showed you earlier.
Value
Value in data science is knowledge gained from data through science -- not machine learning or some application or something. Machine learning or an application is the application of the valuable knowledge we have gained through data science. Knowledge comes first.
So to figure out the value of a data science use case, you’ll need to consider a few questions:
- What is the value of the knowledge gained from doing the data science on that use case?
- What will you learn about the data set?
- What will you learn about the hypothesis you will test?
- What will be the value of that knowledge if you get a good outcome?
- What will be the value of that knowledge if you get a bad outcome?
Think about all these questions for each use case and sum them up into a general sense of how valuable gaining knowledge of this particular problem will be.
Value also means different things to different people and different organizations. Some organizations might value their company’s valuation more than profits. Some organizations are in an extremely competitive business landscape and need to really stretch for something of value. Or value could be non-monetary, in the case of government organizations or charitable organizations. Either way, the value of a use case has to consider the context of the organization’s overall goals.
I prefer to use a linear scale of 0-10 to measure value. Using something like a monetary number is just too much work and prone to too much error. We are just looking for a ballpark here and what is more important is the relative value across use cases. A 7 is slightly more valuable than a 6, but a lot more valuable than a 2.
Level of Effort
Like I said earlier, estimating effort is really challenging in data science. Estimating effort in data science is less about counting data scientist hours and more about getting a sense of the order of magnitude of the problem. I’ve found that estimating the order of magnitude of one data scientist’s time is much easier while still providing value to explain to everyone in the organization how hard it will be to get the outcome.
Here are the "orders of magnitude" I'll typically use:
- 1 hour. Super easy, I can accomplish this by firing a single SQL query and building a quick chart. There is no risk. I know the data is there and the outcome is predictable. If machine learning is used here, it's because I know the data is predictive and I'm just too lazy to write my own rule.
- 1 day. Pretty easy, but I want to be sure I have the proper time to test and understand my results, build some reasonable presentation about the results, and potentially try one or two different approaches. I have a good hunch that the data is predictive or is ready to produce this results. There is little or no risk at all in what I'm about to do.
- 1 week. This is getting more serious, but is still on the lower end of the spectrum. Some risk might be involved, but I'll figure it out pretty quickly if this problem is impossible to solve or not. We need to do some data exploration because I'm not sure if the data is completely ready, but I'm pretty sure it is. I should have some time to fine tune my results and push accuracy numbers up.
- 1 month. This is when we start getting able to explore unknown problems but we have a good sense that the problem should be easy to solve, if it is solvable. We don't know if the data is ready and we might need to spend a week collecting and curating some data. It'll probably be good to do a “check in” and do a data exploration report after first week to re-sync with stakeholders and re-estimate the value and level of effort. We also may not be sure what type of approach will work. Perhaps we need to do some sort of hack with unsupervised learning if the supervised labels aren't good enough, or perhaps a fancy deep learning approach might be appropriate, but we're not sure going into it.
- 1 quarter.This is a complex problem where we're not sure what the data has in it, how we are going to solve it, and what the outcome is going to be. A quarter should give you enough time to get the data, overcome any data challenges, try several approaches, as well as tune results, submit reports, and do analysis throughout the process.
- 1 year. This is where things get fun. This is a type of problem that is going to require some novelty in terms of approach that we're going to use. We’ll do some research where we are inventing new algorithms or approaches that we could likely post in a research journal if we had the time. This is getting risky and most organizations do not have the stomach for something of this length. Whenever I put a problem into this bucket, it pretty much means that you shouldn't work on this problem unless the value is astronomical or is keystone to the survival of your business.
- A lifetime. Basically it'll be someone's life work to solve this problem and is meant in jest. I reserve this label for when someone asks me to do something I think is impossible. Basically, the solution to this problem is probably more valuable in solving the problem itself.
When evaluating each use case, try to fit them into the one of these buckets. Typically to do this you’ll need the end user or line of business to explain to a data scientist what they want to be done. Perhaps the data scientist might have to ask someone knowledgeable about the data some questions. At the end of this a data scientist should be able to give you a sense on the order of magnitude of the problem. This is where a senior, more experienced, data scientist will come in as well as they are much better at having a good sense of this kind of thing.
Risk
Too many times we are eager to just stop at evaluating the value and level of effort of something. Software and IT projects a lot of time don’t have a lot of technical risk so we can usually just ignore it. However, in data science, a negative outcome is very possible in some situations and might even be the more likely scenario. I use the measurement of risk to account for the fact that not everything will go our way.
There are two major aspects of risk to consider. The first is, what are the chances that the data is actually predictive enough to find the answer we are looking for? If the data is low quality or if the question is really hard to answer, then the risk would be higher. The second is risk in the technology being used. If there is a brand new somewhat unproven technique that needs to be used to solve the problem (such as deep learning) then risk goes up. Or if the amount of data is really large and we’re not sure if our data platform can handle it then risk goes up. Again like measuring value, an experienced data scientist or some outside help will really go a long way here in appropriately assessing risk.
I like to assign risk a rough % score, which tells us about what the chances are of the whole use case going well (i.e., we got a valuable outcome). Like the order of magnitudes of value and the linear scale of value, these are somewhat arbitrary and you should focus on the overall meaning up the number. For example, 50% is a toss-up where we’re not sure what will happen. 99% means we’re certain it’ll work out but we are leaving some room for something bad to happen. 80% means we are pretty sure it’ll be fine, but there are still some unknowns we need to work out. 10% is a moonshot where we have no expectation it will work, but there is a chance.
Prioritizing Data Science Use Cases
Now that we have a good list of use cases and have evaluated each for value, level of effort, and risk, we can now figure out what to work on.
Prioritizing is probably the easiest of the three phases, but only if you built a good list of the potential use cases and evaluated them properly. Basically, if you do a good job up until here, it should be clear which use cases should be worked on first. Prioritization is taking a look at the value, effort, and risk of each potential use case and seeing which should be done first. In general, we should move towards high value, low effort, and low risk, but unfortunately for us these factors are typically related. A lot of times, we’ll need to choose risk to get a very valuable outcome, or pick a low effort and low value use case just to show some incremental value and prove out a concept.
There are some obvious choices in which use cases should be tackled first. Ones that are low effort, high value, and low risk. These are at the top right of the square with a large bubble. If you have any of these, do them first. There is also the obvious choice of things to not consider doing it at all. These are high effort, low value, and high risk. Sometimes people just need closure and agree that it’s not worth the time. Once this happens you can stop being distracted by it and focus on more practical use cases.
Once the obvious ones are out of the way, choosing which use case to do first can be complicated because it depends on your personal situation. It has to do with how risk averse you are, how badly you need a win to prove value, or several other factors. Think about what’s important to your organization right now in terms of being able to handle risk, the need to drive value, and how many human resources you have to throw at the problem.
Your prioritization might change over time as you hire more people, have more confidence from the top, or are willing to take more risks, so keep reevaluating often!
Conclusion
I hope by reading this post you have learned that it is possible to rationally think about which data science use cases to tackle next, with or without my particular process. At the end of the day, I think any good process will do the following:
- Try to remove bias in listing out potential use cases. Dare to say “yes” to things that you thought were once impossible.
- Evaluate not only the value and the level of effort of a use case, but also the level of risk.
- Be honest with yourself on what the priorities of your organization are, and align how constrained you are in terms of risk and manpower, and how much value you need from something.


Don is a co-founder of Miner & Kasch, an artificial intelligence solutions and data science consulting firm. Don specializes in large-scale data analysis enterprise architecture and applying machine learning to real-world problems. He has architected and implemented dozens of mission-critical and large-scale data analysis systems within the U.S. Government and Fortune 500 companies. He is also the author of the O’Reilly book “MapReduce Design Patterns”.
Other posts you might be interested in


Subscribe to the Domino Newsletter
Receive data science tips and tutorials from leading Data Science leaders, right to your inbox.
By submitting this form you agree to receive communications from Domino related to products and services in accordance with Domino's privacy policy and may opt-out at anytime.