
Paco Nathan's latest article covers data practices from the National Oceanic and Atmospheric Administration (NOAA) Environment Data Management (EDM) workshop as well as updates from the AI Conference.
Introduction
Welcome back to our monthly burst of themespotting and conference summaries. It’s been a busy conference season, which continues into December. Let’s take a look at two of these recent conferences. We’ll examine National Oceanic and Atmospheric Administration (NOAA) data management practices which I learned about at their workshop, as a case study in how to handle data collection, dataset stewardship, quality control, analytics, and accountability when the stakes are especially high. Even for organizations engaged in markedly different verticals, there is much to learn from them on how to approach data practices. We’ll also look at updates from the O’Reilly AI Conference in San Jose, which showcased recent breakthroughs for AI, especially about breaking through some of our assumed limitations in this field—as well as more about Ray, the project from UC Berkeley RISELab which is beating benchmarks, eating through other libraries’ features, and tracking down Apache Spark for the kill shot.
Data Science meets Climate Science
The most interesting and important conference I attended recently was the NOAA EDM Workshop in Seattle. Environment Data Management (EDM) is an annual meeting for data management teams at the NOAA, this year chaired by Kim Valentine and Eugene Burger. To lend perspective, the Pacific Marine Environmental Lab (PMEL) for NOAA in Seattle is responsible for collecting more than 50% of the world’s research data about oceanography. NOAA hosts a unique concentration of the world’s climate science research throughout its labs and other centers, with experts in closely adjacent fields: polar ice, coral reef health, sunny day flooding, ocean acidification, fisheries counts, atmospheric C02, sea-level rise, ocean currents, and so on. They also manage crucial infrastructure such as the Tsunami Warning System and the National Hurricane Center.
Data veracity, data stewardship, and heroes of data science
In addition to scientists and engineers, NOAA includes paramilitary teams who fly and sail directly into hurricanes. In some cases, their work is vital when millions of lives may be at risk due to natural disasters. In other cases, their work comes under intense political scrutiny, often targeting the veracity of data—e.g., from corporate interests vis-a-vis government regulation of illegal fishing, energy and mineral extraction, oil spills, protection of endangered species, and so on. It’s likely sooner than later that carbon taxes will be looming on the horizon. Ergo the intense need for careful data stewardship. Some adversarial parties go as far as hacking into sensors deployed at sea to disrupt the resulting data analysis and potentially tilt the political outcomes. Given the realities of climate change, species extinction, peak oil, and so on in the 21st century, these folks at NOAA are true heroes of data science in our times.
Considering that context, the data management practices at NOAA are particularly sophisticated, far beyond those of any industry data science teams that I’ve encountered. For example, there are federal laws regarding their data stewardship work. Some of their datasets under management extend back more than 200 years. Consequently, their data policies overall must be defined in terms of centuries. Now they are planning a large move into the cloud, as well as wider adoption of ML.
It’s doubtful that many tech startups will face this level of scrutiny focused on their data teams—even so, there is much to learn from in terms of best practices.
At the EDM workshop, I gave a keynote about AI adoption in the industry. This was alongside keynotes by:
- Rebecca Williams from OMB at the Whitehouse—who helped develop the US federal data strategy and year-1 action plan—check out her slides for the “Federal Data Strategy” keynote
- Ed Kearns, the CDO of NOAA who’s expert leadership has guided the many missions there
- Monica Youngman, director of data stewardship—check out her slides for the “Data Archiving at NOAA” keynote
- Jonathan O’Neil, who’s led the spike on evaluating a large-scale migration to the cloud—check out his slides for the “The NOAA Big Data Project: By The Numbers” keynote
We were onstage presenting that first week in September when people in the audience began murmuring about “Sharpie” and “Alabama” much to our bewilderment. Now I understand some of the realities of their day-to-day work, which aren’t too far off the mark from many corporate environments as well. Check the workshop site for links to slide decks from presentations.
Metadata Challenges
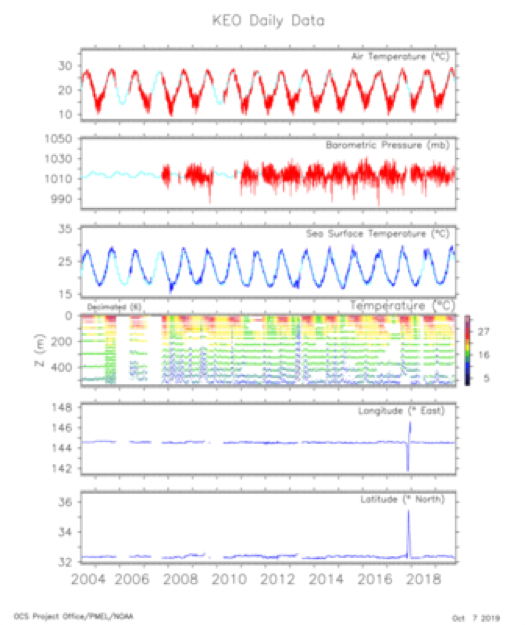
NOAA teams face substantial challenges in terms of metadata exchange: much of their incoming raw sensor telemetry is time-series data, which uses a netCDF TF format natively. The metadata must be converted into both W3C and ISO standards for publication. The data must be converted into a variety of supported formats for download, including JSON-LD. Check out the NOAA data catalog for examples. Overall, these public datasets provide a great resource for when you need interesting data to use in machine learning tutorials, product demos, etc. One area of that data catalog really caught my eye: Mooring Data from the Ocean Climate Stations, which are highly instrumented buoys at sea with several time-aligned signals. The website provides tools to visualize and download specific signals and time ranges:
One of my favorite sessions at EDM (as one might imagine) was about Metadata Tools. It introduced two interesting practices, over and above publishing metadata to describe datasets, described by Tyler Christensen:
- machine-readable data dictionaries
- the practice of making, sharing, and collecting crosswalks
The former is where ML can help in the difficult practical realities of managing datasets. FWIW, I wrote an article recently about related work in using ML to clean up and link metadata: leveraging semi-supervised learning to support reproducible research, as well as recommender systems to assist people coming into data analytics roles at government agencies. The latter provides a mapping between one metadata schema and another. Think of it as “crib notes” that one organization might make to describe the use of another organization’s datasets. Since the EDM workshop, I’ve discovered that crosswalks are available in some of my daily work, to guide my use of datasets that I hadn’t been familiar with before.
Also, a tour of the machine shops and robotics labs at PMEL in Seattle was astounding. My favorite project is their use of saildrones, solar-powered robotic boats that sail out of San Francisco Bay and other harbors, then undertake missions just about anywhere at sea in the whole wide world. The saildrones collect data and report back via a satellite uplink with the Iridium network. NOAA recently launched the largest saildrone fleet ever, used for an arctic ice survey—a total of 6 at once, though it was quite a feat to navigate those in the northern seas. NOAA also recently completed the first-ever robotic circumnavigation of Antarctica. How cool is that?!
We had working sessions about how to retrofit the saildrones with low-power ML on edge devices, using transfer learning with deep learning models to detect and avoid hazards from sea ice. Another question from researchers: “How can we leverage ML to identify sea mammals from onboard video?” Some of the data readings had been modified, so to speak, and needed to be filtered if there were anomalous factors. It turns out that sea lions have discovered these self-powered saildrones, motoring across the sea, which are the approximate size and shape of a small sailboard, and consequently serve as excellent places for the more informed sea lions to chillax at sea. That has to be my favorite use case for anomaly detection, to date.
For more info about the use of saildrones as mobile climate stations, see Ocean Climate Stations, and also check out this photo log of an extended mission.
AI CA 2019 highlights
The O’Reilly AI Conference in San Jose followed immediately after the NOAA EDM. As a testament to the chairs Ben Lorica and Roger Chen, this conference is one of the few that has been able to navigate the fine-line between the latest in academic research and the tangible use cases in the industry, resulting in a blend of both that’s quite rare.
Ray from RISElab: Spark Killer?
All eyes were glued to one talk: Michael Jordan, Distinguished Professor at UC Berkeley, presenting the “On gradient-based methods for finding game-theoretic equilibria” keynote. While headlining an earlier edition of the conference Jordan had introduced the Ray project (read: likely Spark killer) from RISELab. This time he delved into the mathematics describing a progression of machine learning (ML) research, decade by decade. See the video and slides for his talk. This was a tour de force for the mathematics of ML research and what is on the horizon:
- 1990s—focused on “back-end” issues for early e-commerce such as search and fraud detection
- 2000s—focused on the “human side” such as recommenders and social media
- 2010s—focused on “pattern recognition” as in deep learning used for computer vision or speech-to-text
- 2020s—focused on “markets” which exhibit intelligence other than the kind that’s associated with living brains
Machine Learning: Recent Advances and Executive Briefings
Another show-stealer was “Enabling AI’s potential through wafer-scale integration” by Andrew Feldman from Cerebras Systems. In case you’ve missed the news recently, Cerebras made major breakthroughs in hardware development, creating a first-of-its-kind wafer-scale chip—the biggest chip ever made. This new chip accelerates the training phase for deep learning models quite dramatically. As a comparison, the largest GPU processor has 21.1 billion transistors, but the new Cerebras wafer-scale chip features 1.2 trillion transistors and is ~50 times larger in area. There’s so much power going through this new generation of chips that one of the big challenges was not having them melt. Andrew brought one of the wafer-scale chips backstage for us to see…WOW!!! More to the point, this enormous leap in technology translates in practice to non-linear gains: ~50 times larger area for the Cerebras chip translates to 10,000 times more memory bandwidth—which is one of the limiting factors for training large scale networks. See the video.
Another keynote that caught my attention was “Going beyond fully supervised learning” by Srinivas Narayanan from Facebook AI. See his slides and video. Notably, Facebook has built a practice based on self-supervision to manage complex workflows that use generative adversarial networks (GANs) and forms of weak supervision to bring in substantially larger amounts of training data for deep learning models. One limiting factor for deep learning is that you need large volumes of carefully labeled data. Through the use of self-supervision, Facebook can incorporate other data sources that are noisier and less formally labeled—moving beyond the inherent limiting factors of supervised learning—and gain better predictive power. For example, identifying NSFW images gained 62% accuracy. This implies breakthroughs for one of the persistent questions associated with deep learning usage in the industry: what can we do with ginormous amounts of unlabeled data?
During the conference, I hosted the Executive Briefing business track and presented a survey talk, “Unpacking AutoML,” reviewing the many vendors, cloud services, open-source projects, and research efforts emerging for AutoML.
https://twitter.com/miguelmalvarez/status/1177292709138182144
Two of our Executive Briefing talks in particular deserve a spotlight. Ankur Taly from Fiddler presented “Explaining machine learning models” (slides and video are forthcoming). Explainable AI is a current buzzword and I’ve previously covered the pros and cons about making ML models “interpretable” in this column. Zach Lipton has been one of the notable authors and critics of XAI—see his paper “The Mythos of Model Interpretability” for an excellent survey of the issues. Taly presented entirely new perspectives on the subject, and his description of integrated gradients was especially impressive. Translated: while we typically evaluate ML models only after they are trained, one can also look at the inflection points during training, sampling the training data at those points, and then integrating those samples to attribute which data features the models used to make specific predictions.
Speaking of second-order effects in deep learning, the Fiddler talk reminded me of an excellent recent interview with Michael Mahoney on The O’Reilly Data Show Podcast. In brief, deep learning behaves differently than we might expect. For example, we should be seeing local minima problems during training…but we typically don’t. Other mathematical properties of deep learning are not well understood. Mahoney, who led the MMDS algorithms conference, is developing theoretical methods and practical diagnostic tools that should be helpful to practitioners who use deep learning. He’s among the leading mathematicians who are developing a practical theory for deep learning. Mahoney’s study of second-order effects (Hessians) recalled Taly’s discussion of integrated gradients. We still have so much to learn about deep learning in practice.
The other Executive Briefing that I really want to make special note of was “An age of embeddings” presented by Mayank Kejriwal at USC Information Sciences Institute. (Slides and video are forthcoming.) Kejriwal is a professor in the Center for Knowledge Graphs lab. Long-story-short: deep learning applied to natural language has completely overturned best practices in that field over the past two years. The resulting embedded language models created a Sesame Street character roster of state-of-the-art approaches: ELMo from Allen AI, BERT from Google, ERNIE from Baidu, and so on. Language analysis depends on complex graphs. Taking that approach a few steps further—so much of the real-world data is linked, it’s ideally represented in graphs, except that graph analytics can be quite computationally expensive. However, subgraphs within a complex graph can be vectorized and used as embeddings to train deep learning models—much like how sentences and phrases can be vectorized for ELMo and friends. We’re beginning to see graph embedding approaches with deep learning and look toward this for more robust approaches (read: not stuck in relational thinking) for handling real-world data. For more info, check out these https://usc-isi-i2.github.io/kejriwal/ resources.
In other news, spaCy now has doubled its programming staff and just released version 2.2: “leaner, cleaner, and even more user-friendly” with installations that have 5-10 times smaller footprint on disk. Also, stay tuned: next time I promise to explore more details and examples about Ray.

Other posts you might be interested in


Subscribe to the Domino Newsletter
Receive data science tips and tutorials from leading Data Science leaders, right to your inbox.
By submitting this form you agree to receive communications from Domino related to products and services in accordance with Domino's privacy policy and may opt-out at anytime.