
We've used an IPython Notebook that uses Plotly's widgets to create beautiful interactive charts. Read on to see how you can use interactive charts in your own notebooks by using Domino as a central notebook engine — on premise behind your firewall, or in the cloud.
What We Did
Domino lets you run IPython Notebook sessions on powerful cloud hardware (or your own centralized servers) without any setup. Our friends at Plotly gave us a great example notebook showing their notebook widgets, and we uploaded it to Domino so you can play with.
To try it yourself:
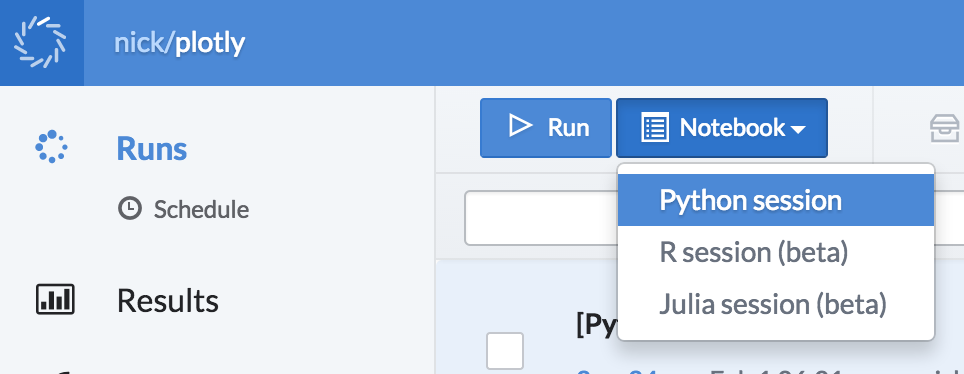
- Start a new IPython Notebook session
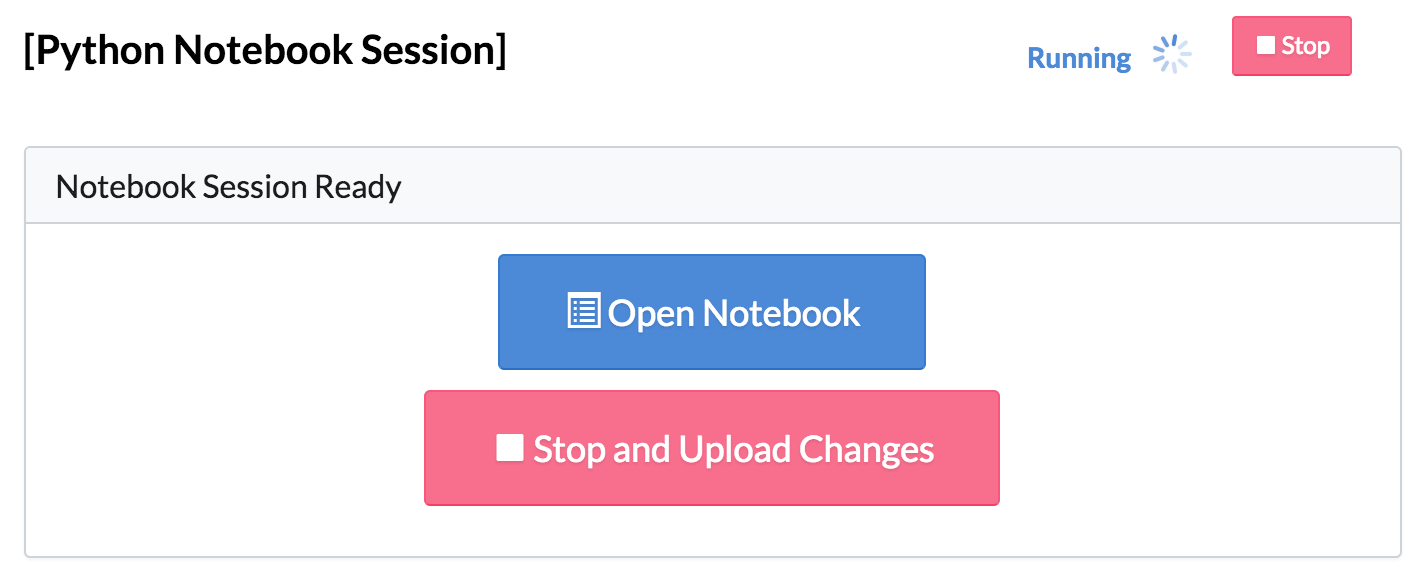
- Open the session
- Open the notebook
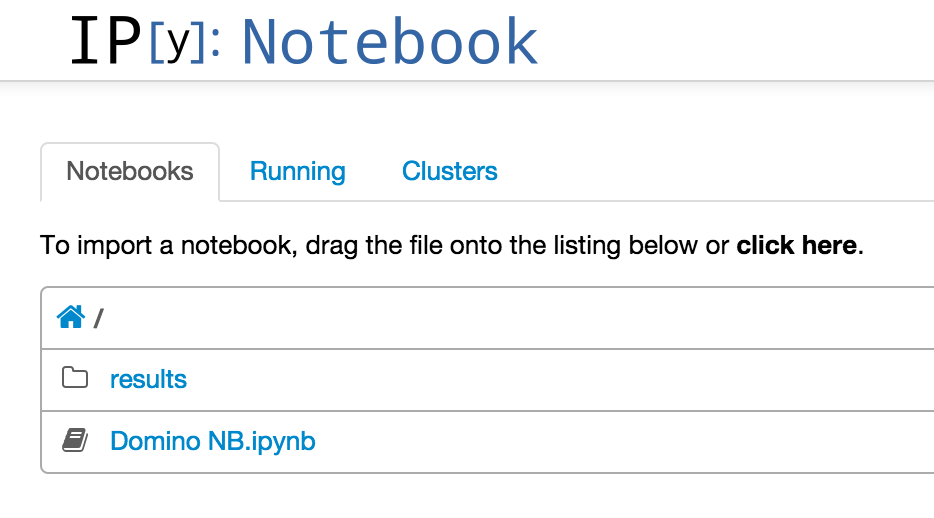
- Evaluate the cells and play around!
Reflections
One of our core engineering principles is to leverage existing technologies when possible, rather than reinvent the wheel. This is good for us, because it saves us from doing a lot of work! But it's also good for our users, because it means they get all the flexibility of existing tools, and benefit from improvements to the whole ecosystem.
In this case: we choose to use IPython Notebook, rather than build our own notebook functionality. As a result, our users can take advantage of Plotly interactive widgets, without any extra engineering on our part. And now we have a great story for how you can use Domino to create interactive notebooks!

Nick Elprin is the CEO and co-founder of Domino Data Lab, provider of the open data science platform that powers model-driven enterprises such as Allstate, Bristol Myers Squibb, Dell and Lockheed Martin. Before starting Domino, Nick built tools for quantitative researchers at Bridgewater, one of the world's largest hedge funds. He has over a decade of experience working with data scientists at advanced enterprises. He holds a BA and MS in computer science from Harvard.
Summary
RELATED TAGS
SHARE
Other posts you might be interested in


Subscribe to the Domino Newsletter
Receive data science tips and tutorials from leading Data Science leaders, right to your inbox.
By submitting this form you agree to receive communications from Domino related to products and services in accordance with Domino's privacy policy and may opt-out at anytime.