
Basics of Digital Signal Processing
A signal is defined as any physical quantity that varies with time, space or any other independent variables. Furthermore, most of the signals encountered in science and engineering are analog in nature. That is, the signals are functions of continuous variables, such as time or space, and usually take on values in a continuous range. To perform the processing digitally, there is a need for an interface between the analog signal and the digital processor. The interface is called analog-to-digital (A/D) converter.
An analog signal is converted into a digital signal by sampling the signal at specified intervals called sampling period. The inverse of the sampling period is called the sampling rate (Hertz; seconds-1) and has to be at least twice as high as the maximum frequency in the analog signal to prevent aliasing (refer to Nyquist–Shannon sampling theorem). In practice the sampling rate is much higher. Common sampling frequencies are 8kHz, 16kHz, 32kHz.
Feature Extraction
Audio signals, specifically speech signals, are typically analyzed in the time, frequency, and cepstral domain. The frequency domain representation of a signal is done by DFT(Discrete Fourier Transform). Assuming a signal x[n]with N samples ranging between 0nN-1, the DFT of the signal X[k]is given by

Here k is the discretized frequency variable that spans from 0kN-1.
The Fast Fourier Transform (FFT) is an efficient computation of the DFT(Please refer to this document from cp-algorithms). Given the stochastic nature of speech signals, FFT is rarely applied over the entire signal at once but rather in frames. Typically, a type of Fourier transform called Short Time Fourier Transform (STFT) is applied on each individual frame.
An illustration of the FFT algorithm on samples of the signal x[n]is shown below
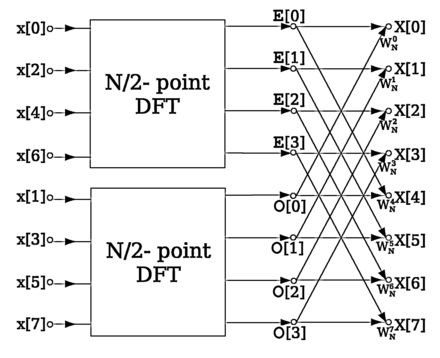
Source: Wikipedia
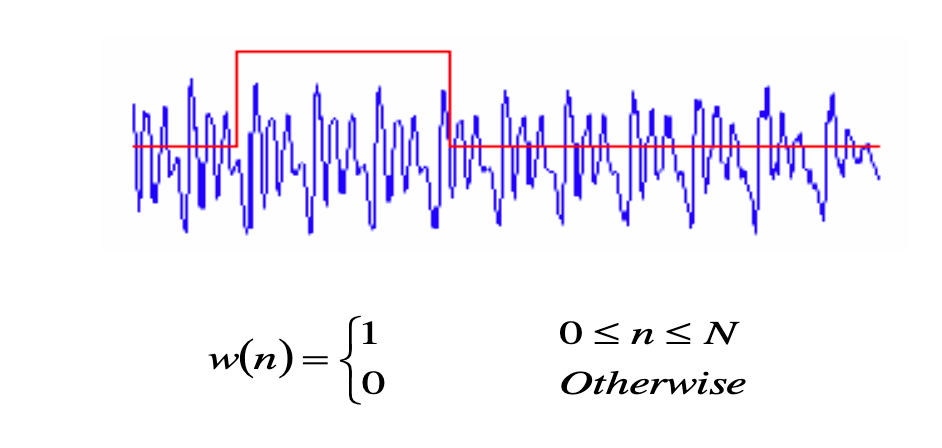
Assume a signal x[n] representing a speech signal and a windowing function w[n]

Human speech is almost always analyzed in frames. The speech signal happens to be a non-stationary signal but in a frame, spanning 20-40ms long, it is assumed for the signal to be stationary. The reason is that vocal tract characteristics do not alter too much during this time span. This is important because a prior distribution can be assumed only if a signal is stationary. In the case of speaker verification the distribution is Gaussian.
There is an overlap of 10ms that happens between each frame. This overlap is present because a triangular window is applied to each frame
(please refer to this article on signal speech processing).
A window can be thought of as an array of non-zero values on the indices where the samples of a frame are ones and zeros elsewhere. When each frame sample of the frame is multiplied by one, it is a rectangular window. With a triangular window, the samples towards the end of the frame get “deemphasized” (i.e. multiplied by numbers between zeros and ones), and samples at the centre get emphasized because of the window’s triangular shape. An overlap of frames is performed in order to compensate for the deemphasizing of the samples at the end of each frame. (Please refer to the question proposed on Stack Exchange)
Furthermore, a rectangular window is almost never used. In the case of a rectangular window, the signal’s samples are multiplied by 1. Since multiplication of two signals in the time domain equals the convolution of the signals in the frequency domain. The Fourier transform of a rectangular window is sinc function. This function has one main lobe at x=0 and side lobes at integer multiples of pi which keep diminishing in values as the absolute value of x xkeeps increasing.

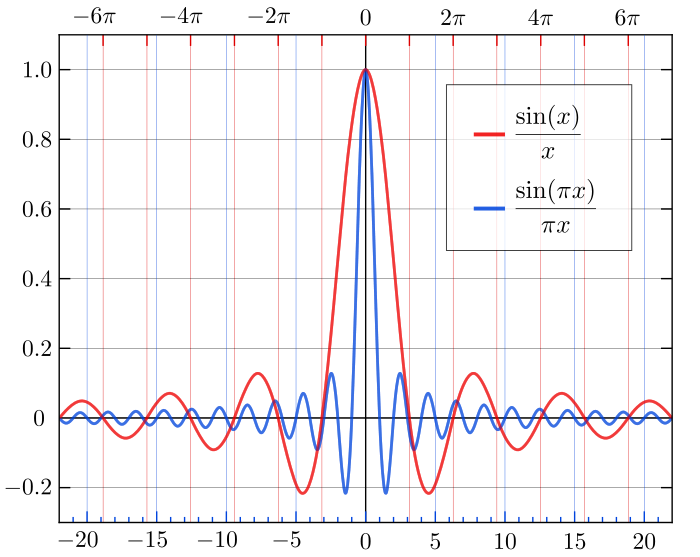
(Source: Wikipedia)
When this function is multiplied by the Fourier transform of the speech signal, spectral leakage happens at the side lobes which is not ideal. Spectral leakage occurs when a non-integer number of periods of a signal is sent to the DFT. Spectral leakage lets a single-tone signal be spread among several frequencies after the DFT operation.
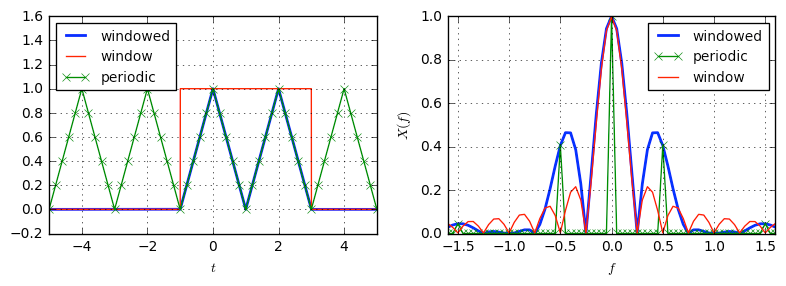
(Source: DSP Illustrated)
In the above image, let’s assume a signal of interest, i.e. the triangular periodic signal in the left which is multiplied by the red rectangular window. The convolution of these signals as displayed in the above figure on the right. The convolution of two signal is given by
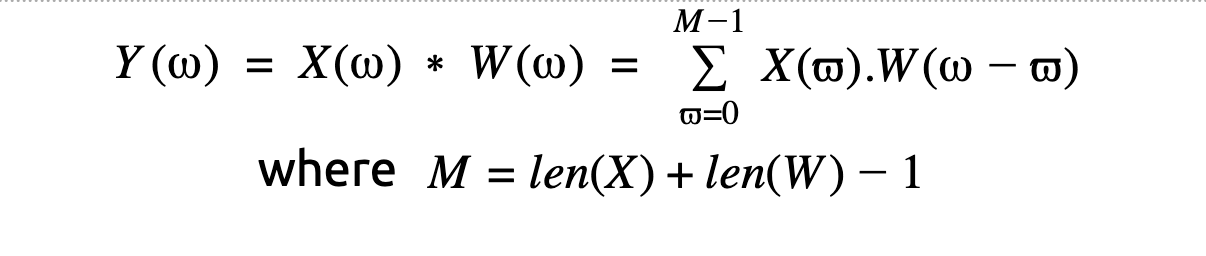
In a nutshell, convolution of 2 signals is when one of the signals is reversed and the samples are multiplied by the other signal. For sake of understanding the signal
As you can see, in the blue plot above, the “windowed” signal (result of convolution) which has spectral leakage on the side lobes. The red signal is the transform of the rectangular window.
To reduce spectral leakage, triangular shaped windows like hanning windows, hamming windows, and triangular windows are used.
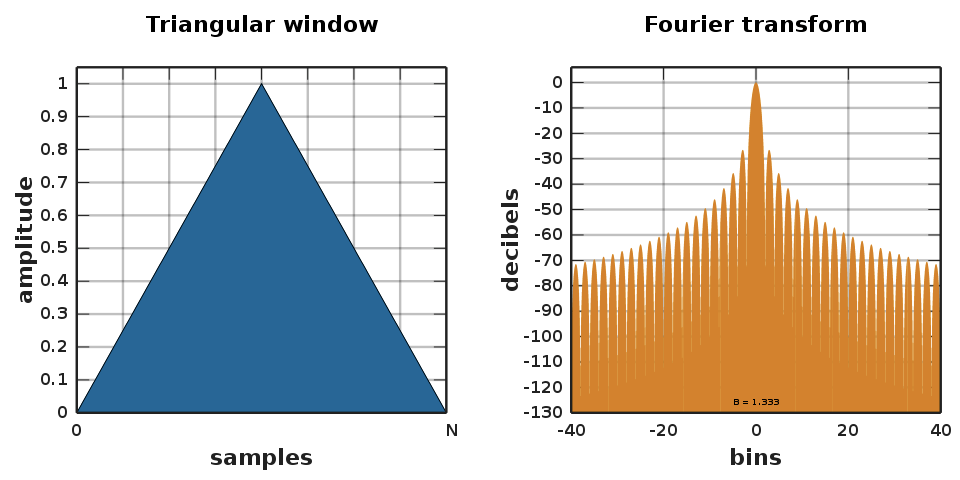
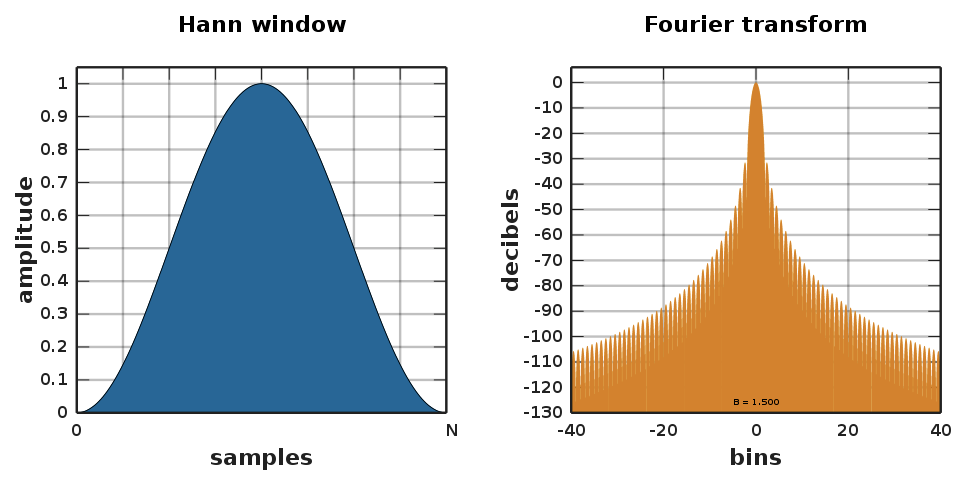
(Source: Wikipedia)
The hanning window function is given by

The triangular window is given by

Framing of a speech signal can be visualized below:
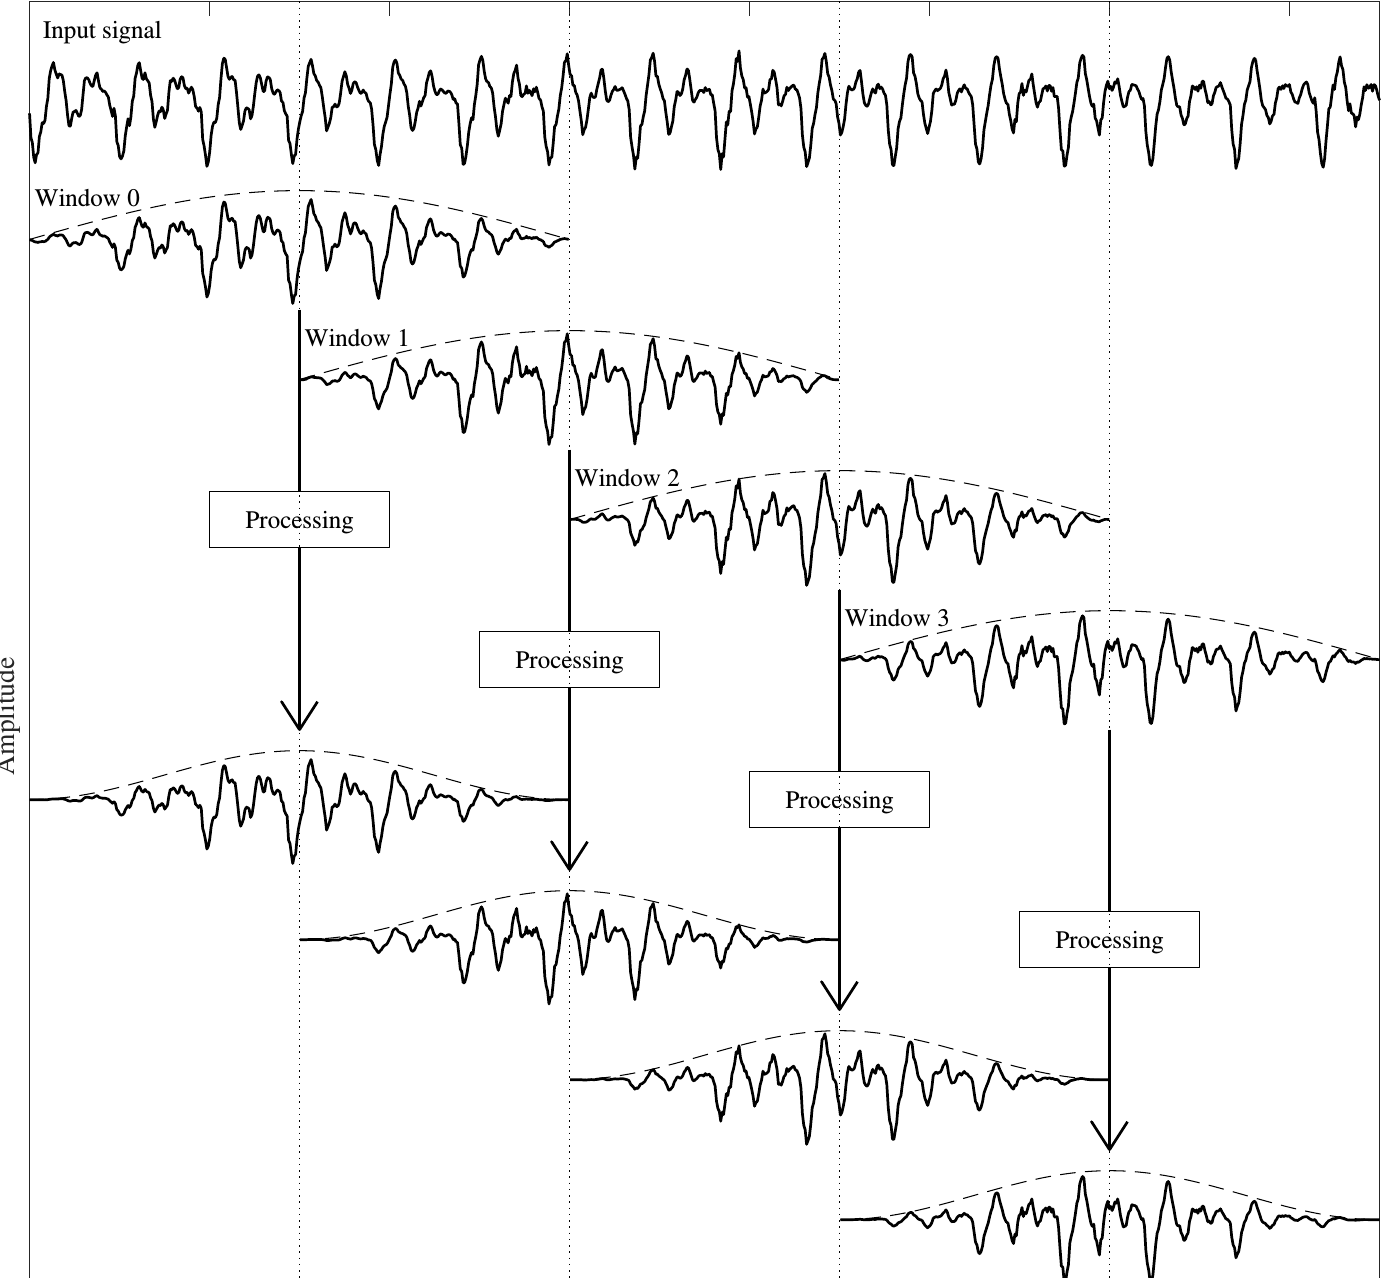
(Source: Aalto University)
Mel Frequency Cepstral Coefficients
MFCCs as the name suggests are coefficients and features in the cepstral domain. (ceps is ‘spec’ in reverse) These features are ubiquitous in speech processing and MIR (Music Information Retrieval ) applications. Unlike DFT, the frequency is on a logarithmic scale or mel scale. The mel-scale is similar to the scale of human hearing. The number of hair cells for lower frequencies are way higher than higher frequencies. Hence, as we age our ability to discern between higher frequencies tends to diminish. This decrease in resolution to higher frequencies is accomplished by the Mel Scale.
Briefly, over a time domain signal’s frame, STFT is applied and to this signal overlapping triangular windows in the mel scale i.e. a type of logarithmic scale is applied. Then a discrete cosine transform is applied and the first 13 coefficients are referred to as the MFCCS. The delta coefficients and the double delta coefficients are extracted from each frame together making a 39 dimensional array. Hence, if an audio signal has 100 frames, the MFCC array will have a dimension of (100,39)
The relationship between mel-scale and linear scale is given by

Where f denotes the physical frequency in Hz, and fMel denotes the perceived frequency
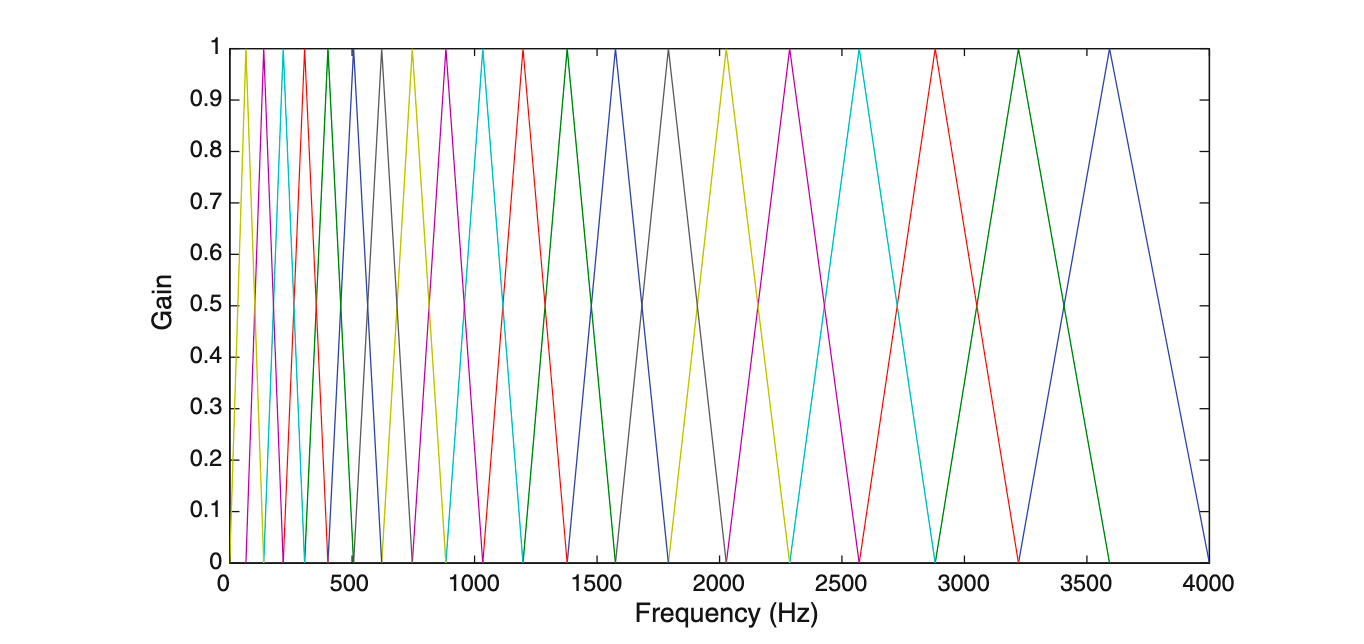
The Mel filterbank looks like this
To extract MFCCs the following steps are done:-
- Pre-emphasis - This is a high pass filter to balance the spectrum of voiced sounds that have a steep roll-off in the high-frequency region. The coefficient used in this project is 0.97. This value mostly varies between 0.9 and 1
- Framing and windowing - discussed above
- DFT of the spectrum - The frame of the signal frames are performed
Mel Spectrum - The Mel spectrum of the magnitude spectrum X(k) is computed by multiplying the magnitude spectrum by each of the triangular Mel weighting filters.
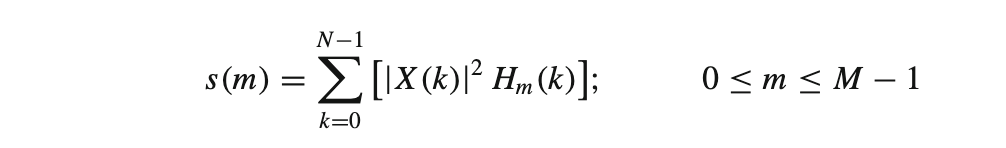
where M is the total number of triangular Mel weighting filters.
Hm(k)is the weight given to the kth energy spectrum bin contributing to the mth output band and is expressed as:
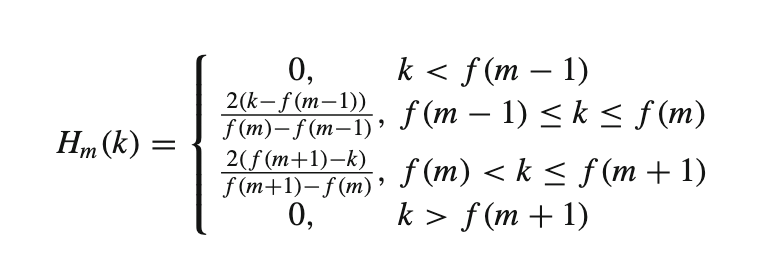
With m ranging from 0 to (M-1).
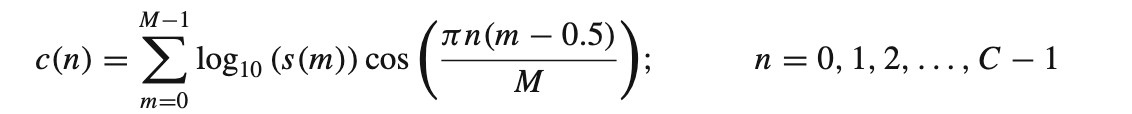
- Discrete cosine transform (DCT) of the Mel spectrum is applied to transform logarithm of Mel frequency coefficients to a set of cepstral coefficients.
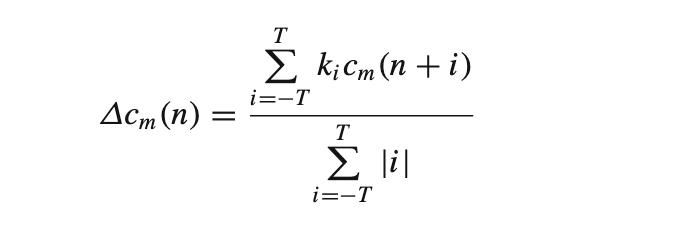
- Dynamic MFCC features: The cepstral coefficients are static features. The delta coefficients derived from these are the first order derivatives and the delta-delta coefficients are second order derivatives. These represent the speech rate and acceleration of speech respectively.
SHARE
Other posts you might be interested in


Subscribe to the Domino Newsletter
Receive data science tips and tutorials from leading Data Science leaders, right to your inbox.
By submitting this form you agree to receive communications from Domino related to products and services in accordance with Domino's privacy policy and may opt-out at anytime.