Defining Metrics to Drive Machine Learning Model Adoption & Value
David Bloch2021-03-03 | 12 min read

One of the biggest ironies of enterprise data science is that although data science teams are masters at using probabilistic models and diagnostic analytics to forecast revenue or identify the potential value stream of an asset, in most cases, very few analytical techniques are applied to the way they measure the value of their data science initiatives. It's often stated that nothing changes inside an enterprise because you've built a model.
In some cases, data science does generate models directly to revenue, such as a contextual deal engine that targets people with offers that they can instantly redeem. But in most cases, models are enablers of value creation through either transforming processes to create new efficiencies or revenue generation or by enabling better decision making.
And there is part of the challenge, the difficulty in assessing the value of a good decision.

It's all too easy to review the balance sheet impact of poor decisions in hindsight. Still, we often lose context regarding the inputs, assumptions, and external factors that may impact a bottom-line result. But what about good decisions? How do we track value enabled through better decision support such as a machine learning model or a diagnostic visualization versus an experienced manager making decisions?
Align on Key Indicators of Success During the Initiation Phase of a Data Science Project
Data Scientists need to get better at marketing their own success inside organizations. One of the key elements of showcasing these successes is setting clear expectations with stakeholders during any project initiation phase. As you're designing your problem statement and the initial hypotheses and assumptions related to the data you have available, start to interpret what indicators you can use to measure meaningful success.
These indicators can be broken into three key categories
- Leading Metrics
- Think of these as a good sign that the actions and activities you're taking will lead to a positive outcome. These could be things such as the total volume of opportunities being processed into a sales queue, or alternatively, the number of potential health and safety risks being recorded in an occupational safety platform based on recommendations and prompts.
- Lagging Metrics
- These indicators can only be measured at the end of a full prediction stage; i.e., if we're predicting that prices of a certain commodity will increase and we take action such as setting a future contract to create a set price, we can only measure the success of this prediction once the commodity price refreshes. This gives us real metrics with which to identify the performance of models.
- Usage / Health Metrics
- Tracking the overall usage and health of models is essential to converting more of your data science projects into data science products, tools that have been adopted by the end-user to help transform business operations and improve decision making. These are often forgotten by data science teams but ultimately lead to understanding any friction points. The model results may need to be iterated to be more impactful in the business.
Starting the process of capturing these metrics from the start of your data science project should be seen as a natural addition to writing a problem statement and conducting exploratory data analysis on that problem. Many of the diagnostic insights you uncover as a data scientist while profiling data can be used to identify key top-line metrics that will signal areas in which a model will feasibly impact the business unit.
How to Create Concise Metrics to Set Clearer Expectations
Much like writing key performance indicators within a job description, being clear, concise, and precise with the metrics is important.
Good metrics for evaluating a model should comprise the following:
- Type of Metric ( Leading / Lagging / Usage )
- Metric Name
- Description of the metric
- The frequency that the metric can be assessed
- The rationale as to why the metric is important
Agreeing on the rationale of a metric and identifying the frequency at which that metric can be tracked is an important stage in setting clear expectations with your business stakeholders.
By aligning with your stakeholder on what metrics can be used to assess likely performance means that you're not waiting for a full prediction cycle to assess the impact of the model, and conversely means you're able to identify other factors of importance that may not have been identified in the initial build of the model.
If we only track lagging indicators of performance, then we're not able to positively impact how a model will lead to results based on the leading indicators that we can measure at a faster cadence.
For example, many sales organizations track sales quarterly. This is due to the amount of time that a sales motion takes to complete. If we only review our model's performance at the end of a sales cycle, we may miss major elements that could help us improve or iterate the model itself to drive better success.
We will likely identify measures that correlate to good results of success through our exploratory analysis of a problem.
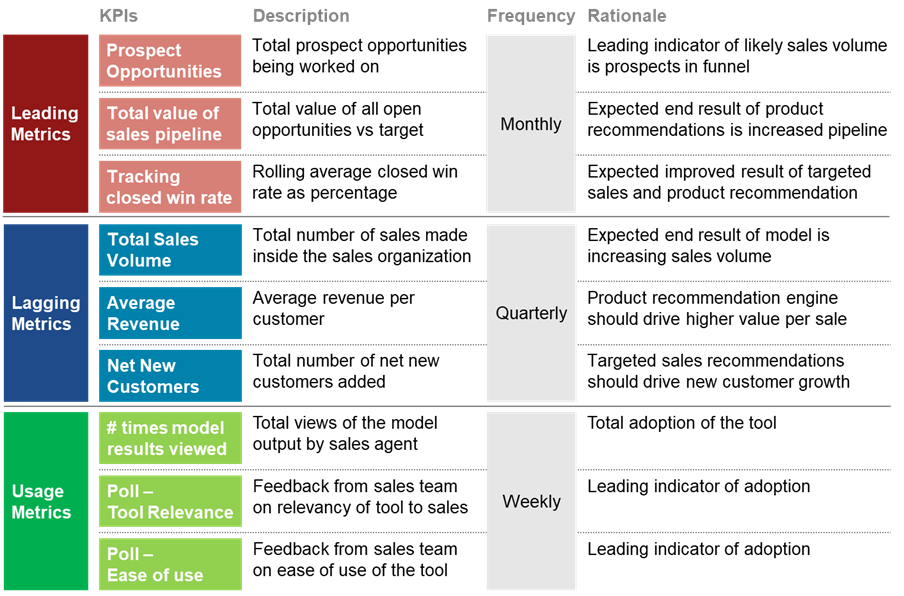
Metric examples for a model optimizing sales results
Let's say that we've built a model to identify prospect opportunities with the highest close rate based on demographic analysis and next best action style product recommendations. We also use this model to target potential prospects with digital campaigns, and as such, we now expect to see that our funnel of opportunities should significantly expand.
Our desire is to improve the total volume of opportunities we have in the pipeline and increase the value of these opportunities by better fitting products to their requirements and thinking of other strategies such as bundling offers.
We can track this by looking at the total number of prospect opportunities we have in our pipeline, the deal score of those opportunities (i.e., how likely the salesperson thinks the deal is likely to close), and the total value of our opportunities against our sales target.
Because these metrics don't require the end result of whether or not we closed the sale successfully, we can track them at a higher frequency rate and use them to identify the positive impact on performance that our model results have provided.
Conversely, if we do not see a positive impact on these metrics, we need to improve the way our model operates to create better results, in which case we would iterate the model on new insights being generated by real-world testing of the model results.
Tracking these metrics helps us understand the success (or not) of our model in the initial stages. They also help us drive adoption by creating better awareness of how the model performs for the sales team.
Leveraging Usage/Health Metrics to Drive Model End-user Adoption
As Gartner, Harvard, and other organizations remind us, most models fail to reach production inside modern enterprise organizations. While many consider this problem to be one about technical deployment challenges, a recent survey we conducted with DataIQ pointed towards model adoption by end-users being the main stumbling block.
There is a growing need to take a page out of product management principles for deploying data science projects.
- Data Science projects can be considered code, compute, and some sort of interface.
- Data Science products are where we start to think about end-user engagement, iterative design on both model results and the tool they interface with, and ongoing management, monitoring, and measurement of the model value.
With this in mind, we must identify health and usage metrics that allow us to understand how our model results are being adopted by our end users, what the sentiment those end users have towards the tool, and any potential changes that we should consider making to make the model result more impactful.
Using our sales example again, we identify the following metrics to track the usage/health of our model results
- How many times the model results have been viewed by the sales agent.
- A poll to identify how relevant the sales agent feels the model has been to their sales process.
- A poll to identify any potential improvements or iterations that could be made to improve the tool.
These metrics allow us to go deeper than indicators of model success. They enable two-way communication between the data science team and the model end-users. Any quirks relating to model performance or any areas where the model is simply not being adopted can be identified and included in an overall onboarding framework.
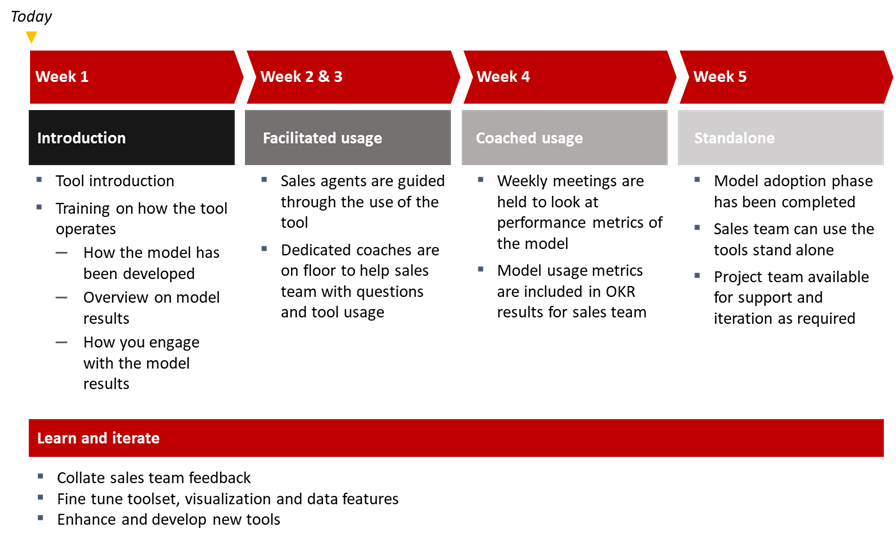
Example model adoption framework for end-users
Using these metrics to develop a rollout plan helps us gain consistent, early feedback that isn't dependent on long sales cycles closing for us to assess whether or not the model is effective.
Including polling of our users to understand how they perceive the model and any changes they may make gives us further understanding that we may not get in result indicators alone and ensures that they have a way to communicate their thoughts and feel involved in the overall success of the data science product itself.
Through the stages of adoption, these metrics help keep business units engaged and aware of the way the models help to drive results in their unit and also mean that when it comes time to identify the value being generated by data science units, we have a much clearer path for identifying the business value that our models enable inside different parts of the business.
Conclusion
Tracking data science projects' value at an individual level is considered tricky by many enterprise data science teams. This is often because data science enables business units to make decisions better or transform the way they operate, meaning that a direct line to value isn't always easy to find.
Ensuring that all data science initiatives include measures and metrics of success is a key part of aligning with business units and creating clear expectations of how model results will enable value. Still, these metrics cannot rely solely on the end result - such as the successful closure of a sale based on a model recommendation.
Incorporating these indicators into your model adoption framework helps create better alignment between business end-users and data scientists. This helps ensure that more models make it into production, not just technical production but also critically end-user adoption of model results.

Other posts you might be interested in


Subscribe to the Domino Newsletter
Receive data science tips and tutorials from leading Data Science leaders, right to your inbox.
By submitting this form you agree to receive communications from Domino related to products and services in accordance with Domino's privacy policy and may opt-out at anytime.