Racial Bias in Policing: An Analysis of Illinois Traffic Stop Data
Domino2018-01-10 | 14 min read
Mollie Pettit, Data Scientist and D3.js Data Visualization Instructor with Metis, walks data scientists through analysis of Illinois police traffic stop data, presenting a story narrative of Chicago in 2016. Pettit also discusses how, and shows why, data scientists need to be thoughtful and aware of assumptions when analyzing data and presenting a story narrative.
Session Summary
At a Data Science PopUp in Chicago, Mollie Pettit covered data analysis done on 2016 Illinois police traffic stop data. Pettit reviewed how the data was collected, how to challenge assumptions when analyzing the data, and in what instances bias was or was not found in the data for Chicago in 2016.
Key highlights from the session include
- in Chicago, searches were conducted at a significantly higher rate for black and Hispanic drivers than other groups, but with the lowest contraband “hit” rates
- in Chicago, black drivers were significantly less likely to receive a citation than drivers of other races
- across Illinois, Black and Hispanic drivers were typically more likely to be searched, Asian drivers less likely to be searched, and Hispanic drivers more likely be cited
- data science is an iterative process that includes challenging assumptions by continually asking questions
Pettit closed the session with a reminder for data scientists to consider assumptions
“I just want to remind people that when doing analysis, one should be very thoughtful about the assumptions that they're making about their data. If assumptions are ignored, it can be very easy to tell a story that the data doesn't fully support on its own and this is something to keep in mind across all industries, whether it be working with a nonprofit or an insurance company.”
For more insights from the session, watch the video or read through the presentation transcript.
Video Transcript of Presentation
Hello, everybody. My name is Mollie Pettit. My Twitter handle is @MollzMP. If you want to tweet at me, feel free. I am currently a D3.js data visualization instructor with Metis. I'm also a data scientist. I formerly worked with Datascope Analytics, which is now part of IDEO. And it's actually with Datascope that I worked on a project that I'll be telling you about today. We're going to be looking at racial bias in policing, specifically in analysis of Illinois traffic stops data.
In 2016, over two million police traffic stops occurred in Illinois. For each stop that happened, an officer filled out this form. I'm going to just walk you through the form a little bit, because it will help you understand what the data looked like that we were working with. They [the officers] filled out this form. They guessed the race the driver; recorded why the driver was stopped-- were they speeding, seat belt, equipment violation, et cetera-- whether or not the police officer conducted a search; if searched, whether or not contraband was found-- contraband could be drugs, weapons, stolen property-- and then what action resulted. Did they get a citation? Did they get a verbal warning, a written warning? This is the kind of data that we have to work with.
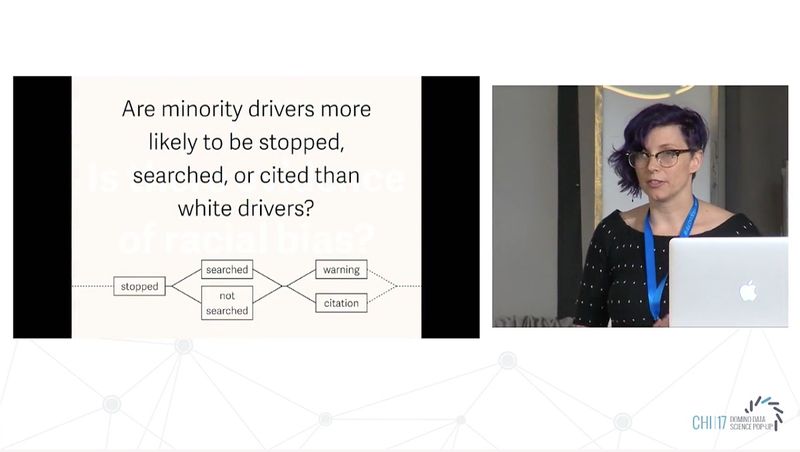
Other cities have looked at similar data-- New York Times, Washington Post, Texas Tribune, Miami New Times-- and reports from other cities have suggested bias in traffic stops. Does the Illinois data reflect that? Is there evidence of racial bias in the traffic stops data? And to rephrase that in another way, are minority drivers more likely to be stopped, searched, or cited than white drivers? We did analysis for all of Illinois, but for this talk I'm going to zero in and take a look at Chicago, specifically for the 2016 data. We also looked at other years as well, but right now we're just looking at 2016.
Again, this question-- and you can actually think of this going forward as-- this graphic-- as our agenda as we go through. We're first going to start by looking at who was stopped. Later, we'll look at searched and cited. So, who was stopped in 2016? Before we look at that, we're going to look at the Chicago population.
In this graphic, each color represents a different race or ethnicity. The proportions seen here mirror the proportions of the demographics in the Chicago population. In a perfect world without bias, if we assume the driving population mirrors the city population, we would hope that these two would look the same, that the stops would reflect this. The proportions seen in the bottom graphic mirror the proportions of the stopped population. The proportion of black drivers in the stops population is twice the proportion of black drivers in the city…sorry, black residents in the city. The proportion of white drivers in the stops population is half the proportion of white residents in the city.
A question that might come up here-- because this is an interesting graphic in itself, right? In the bottom, the amount that black drivers fill up with stops is very large compared…but does this alone-- does only looking at this imply bias? We'd argue that, on its own, not quite and we're going to talk about why not.
There's a couple of things here. First of all, we were looking at the city population versus the stops population. Now, to imply bias here, we would be making an assumption that the demographics of the residential population of Chicago is the same as the demographics of the driving population of Chicago. And the truth is, we don't actually know what the driving population is. We can make guesses and there's a variety of ways that we can make these guesses more accurate, but there's a lot of things to consider here.
First of all, who uses transit? Who drives to work? Who lives near work versus far from work and therefore spends more time on the road? And a question pertinent when looking at towns and cities that are not Chicago, might be, is this a drive-through town?
Perhaps the town has a largely white population but is often traveled through during work commutes by residents in neighboring towns that have higher minority populations. These kind of factors make the driving population difficult to know for sure and also difficult to compare directly to a city's population. Additionally, another thing to point out is that this traffic stops data is reported by the officer, not the driver. The census data is reported by each individual, which is a subset of the driving population. So, because these two data sets are being recorded by completely different sets of people, you can't completely know how well they do or do not correlate.
And then to make it even more confusing, the two forms define race a little bit differently. Hispanic and Latino is a race on the traffic stops form, where it's ethnicity on the census form. This causes even more complications with matching up the data.
OK. So, sure, all I've said so far is that with what I've shown you so far, it's not quite enough to imply any sort of bias here. And sure, we don't know the exact driving population, which does make it unwise to infer bias on stops alone. However, we do have the stop population and we know the race that the police officer assumed of everyone who was stopped and what happened after they were stopped.
Were they searched? Were they not searched? Were they ticketed? Was a particular group more likely to be searched or given a ticket? And this is where we felt bias could be more accurately detected and with greater significance.
We're going to dig in and we're going to look at who was searched. From here on out, when I talk about race, this is the race assumed by the police officer. As we can see here, of black drivers stopped, 1.7% were searched, Hispanic 4.3%, white drivers 0.8%, and Asian 0.6%.
When a police officer pulled over a person in 2016, they were definitely more likely to search a person if they were Hispanic or black.
I want to plot this in another way, so we can compare it to the rest of Illinois. In the x-axis, you'll see the white search rate. On the y-axis, the minority search rate and if everything is equal when I plot a department-- first we'll show Chicago-- then if everything is equal, then it would fall in the line of equality. If it's above the line, minority drivers are search at a higher rate, below they're searched at a lower rate.
So, where's Chicago? There's Chicago and these values, specifically for the Hispanic and black populations, do indicate racial bias in Chicago when it comes to who police choose to search. And yes, before you ask, we did check statistical significance. The black and Hispanic search rates differ from the null in a significant way, while the Asian rates differ less and are closer to what you might expect in a fair system. So, let's throw up all of Chicago as well. Sorry, all of Illinois. As you can see, nearly all police departments search black and Hispanic drivers at a higher rate than white and Asian drivers.
A common criticism of this particular test is that it doesn't take into account whether or not anything was found. And some critics might suggest, well, these higher rates are justified if the hit rates for that group is higher as well, is what some people might suggest. What I mean by hit rate is if contraband was found or not. We can look at where contraband was found.
There were lower rates of contraband discovery for black and Hispanic drivers, despite the fact that black and Hispanic drivers were more likely to be searched in 2016. I'll throw this up on a plot with the rest of Illinois data. It's a little bit less dramatic than the last set that I showed you, with more departments clustering around the equality line, but it's worth noting that most departments in Illinois did find contraband at lower rates when searching black and Hispanic drivers than white drivers.
The last one I want to explore is who was cited. Hispanic and white drivers were more likely to get cited, with Asian drivers closely behind. Within the population of pulled over black drivers, they were less likely to receive a citation. But it's still worth noting that because of the amount of black drivers pulled over, they received more than half of the citations issued in Chicago. If we put these up on same plots as before and look at all of Illinois, in general, things fall a lot closer to equal on this one. Hispanic drivers were the most cited across all of Illinois and Chicago is a little bit closer to equal than other departments in this.
The main summary that I have for you today is that in Chicago in 2016, the proportion of black drivers in the stops population was twice the proportion of black residents in the city population. There are more searches conducted of black drivers than any other group, but with the lowest contraband hit rate. Black drivers received a significantly lower ratio of citations than drivers of other races. Hispanic drivers were significantly more likely to be searched in Chicago and significantly more likely to be cited across Illinois. And there's also a lot of other factors to explore, many of which we have, and I just didn't show you, and others which we hope to still dig into.
A conclusion, I just want to remind people that when doing analysis, one should be very thoughtful about the assumptions that they're making about their data. If assumptions are ignored, it can be very easy to tell a story that the data doesn't fully support on its own and this is something to keep in mind across all industries, whether it be working with a nonprofit or an insurance company. Not to say that assumptions should never be made-- they're necessary sometimes. And heck, they're necessary often-- but being explicit about them is very important. If you want to check out more of this work, here's a couple places you can find that-- Stanford Open Policing Project and Open Data Policing. These are some other people that are doing things in this realm. If you want to check out the Illinois data or learn more, feel free to contact me. Thank you to the ACLU of Illinois for providing us the data and working with us on this. And thank you to Datascope for the help and feedback. And thank you to you for listening to me.
Domino editorial note: this transcript has been lightly edited for readability.

Domino Data Lab empowers the largest AI-driven enterprises to build and operate AI at scale. Domino’s Enterprise AI Platform unifies the flexibility AI teams want with the visibility and control the enterprise requires. Domino enables a repeatable and agile ML lifecycle for faster, responsible AI impact with lower costs. With Domino, global enterprises can develop better medicines, grow more productive crops, develop more competitive products, and more. Founded in 2013, Domino is backed by Sequoia Capital, Coatue Management, NVIDIA, Snowflake, and other leading investors.
Other posts you might be interested in


Subscribe to the Domino Newsletter
Receive data science tips and tutorials from leading Data Science leaders, right to your inbox.
By submitting this form you agree to receive communications from Domino related to products and services in accordance with Domino's privacy policy and may opt-out at anytime.