Analyzing Large P Small N Data - Examples from Microbiome
Bill Shannon2020-11-17 | 14 min read
Introduction
High throughput screening technologies have been developed to measure all the molecules of interest in a sample in a single experiment (e.g., the entire genome, the amounts of metabolites, the composition of the microbiome). These technologies have been described as the ‘universal detection’ of molecules in cells, tissue, or organisms in an unbiased and un-targeted way[1]. It is hoped this data will give researchers a better understanding of what they are studying.
Classical statistics, developed in the 20th century for small datasets, do not work for data where the number of variables is much larger than the number of samples (Large P Small N, Curse of Dimensionality, or P >> N data). Our previous Domino Blog on the Curse of Dimensionality[2], describes weird behaviors that emerge in data when P >> N:
- Points move far away from each other
- Points fall on the outer edges of the data distribution
- Predictive models fit to noise approach 100% accuracy
- Pairwise distances between points become the same
Each of these behaviors wreak havoc on statistical analyses. For example, it’s impossible to know if your predictive model is accurate because it is fitting important variables or noise.
Reduce the Data for Analysis and Interpretability
Using automatic algorithms for data reduction has problems. Consider a dataset with 500 variables with PCA being used to reduce the dimensions to a handful for analysis. On close examination it is seen that PCA produces linear combinations of the variables – – which is uninterpretable. Understanding the meaning and interactions of 500 coefficients is not possible. Each PCA projection is uninterpretable so learning is not possible.
As we are still left with a Large P Small N problem, direct hypothesis testing is not possible. Instead, the goal at this stage of the analysis is interpretation and learning. It is important to treat this analysis as exploratory. This exploratory analysis is not conducted by analyzing all the data at once to see what stands out. Instead of using algorithms to reduce the data, pick subsets of variables that are biologically meaningful and can be interpreted. Anything that is discovered in subset analyses should be viewed as hypothesis generating and potentially testable in follow-up designed experiments.
Two analyses done by BioRankings are presented here as examples of this approach. Both involve high throughput screening data and hundreds or thousands of variables from a hundred or so subjects in a pre-diabetes study as part of the Integrative Human Microbiome Project.[3] In the first analysis 12 cytokines were selected to test if changes in cytokines are associated with changes in the composition of the gut microbiome. In the second analysis a subset of the genes from gut microbioal taxa were selected to test if gene copy number was associated with conversion from insulin sensitivity (good outcome) to resistance (bad outcome).
Are Cytokines Levels Associated with Gut Microbiome Composition?
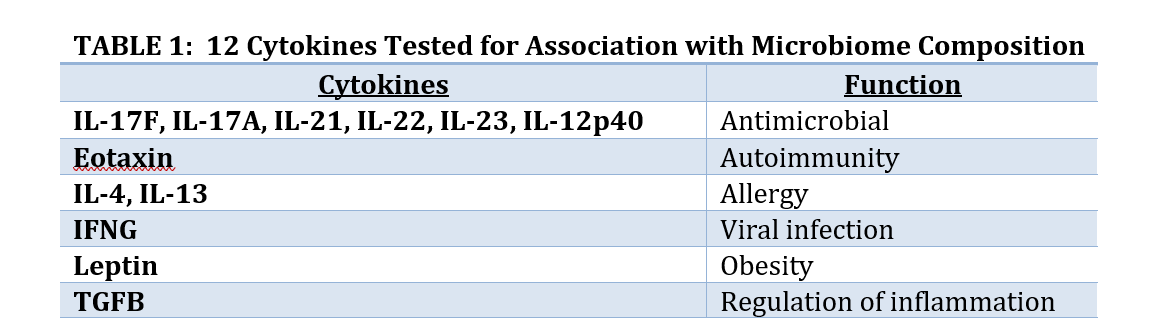
Collaborators were interested in seeing if cytokines might be associated with microbiome composition. Cytokines are small peptides associated with many biological outcomes such as inflammation, sepsis, development, and other outcomes. Hundreds of small peptides and cytokines were measured so a subset of 12 thought to be associated with development of diabetes were identified to avoid the problems associated with Large P Small N, and to have a focused subset where biological interpretation is possible. The 12 are listed in Table 1. Since Large P Small N data is exploratory the analysis of these 12 peptides does not preclude us from analyzing other subsets of peptides.
Regression analysis is often used in statistics to associate an outcome (dependent variable) with input covariates (independent variables). These models are well developed when the dependent variable is continuous, categorical, or survival time. However, no regression model existed for the case where the dependent or outcome variable is the microbiome taxa composition.
To regress microbiome composition (dependent or outcome variable) onto cytokines (independent or input variables) we derived and published a new regression model.[4] The method DM-RPart combines recursive partitioning and the Dirichlet-multinomial probability model. Recursive partitioning finds regions of the covariate space where the outcome is more homogeneous.[5] The Dirichlet-multinomial probability model applies to microbiome data and provides methods for hypothesis testing, sample size and power calculations, effect size, overdispersion, and other classical statistics.[6]
DM-RPart finds partitions, or subsets, of microbiome samples such that the taxa composition or proportions of the samples within a subset are more like each other than to samples in other subsets. Cluster analysis finds partitions based on distance (i.e., unsupervised learning) which ignores the information in the covariates. DM-RPart is a supervised learning algorithm using the information contained in the covariates.
Partitions in DM-RPart are defined by thresholding covariates –e.g., if a sample has Leptin < 1476 put the sample in the left child node, otherwise put the sample in the right child node. Selection of the order of the best splits is done automatically by optimizing the maximum likelihood ratio (MLR) of the Dirichlet-multinomial probability model comparing the samples in the parent node to the samples divided into the two child nodes. The more homogeneity induced by partitioning a parent node into two child nodes the higher the MLR. The partition of any parent node is done on the covariate split with the largest MLR.
We applied DM-RPart to the 12 cytokines above based on biological theory of possible mechanisms of action on the gut microbiome. Figure 1 shows the model partitioned 128 microbiome samples (top or root node) into 5 subgroups (terminal nodes). The 128 samples are first split based on the subject having Leptin above or below 1476. Of the 57 samples whose subjects had Leptin < 1476 a second split on IL4 above or below 60 divided them into two subsets of 37 and 20. This is repeated until a large tree is grown which is then pruned back to avoid overfitting.
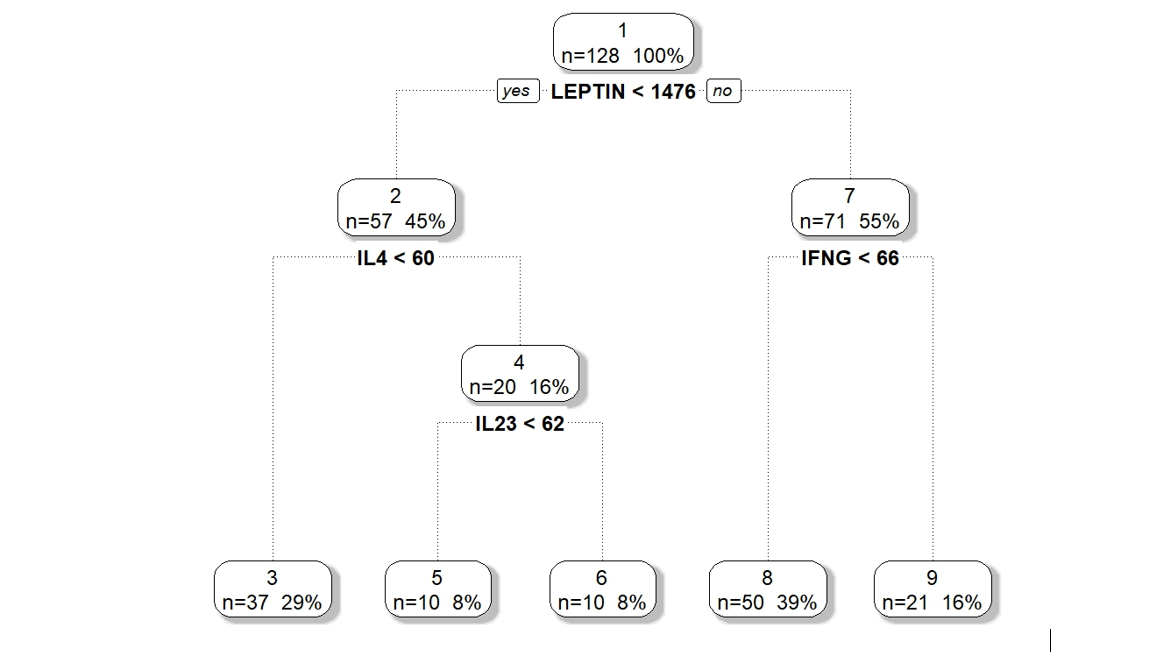
Figure 1 : DM-RPart model for regressing microbiome taxa composition onto 12 cytokines.
The colored bar charts in Figure 2 show the microbiome composition within each subgroup. Each color corresponds to one taxon (see legend at top of figure) and the heights of the color segments corresponds to that taxon’s proportion within the population. There is large variation in taxa composition across subgroups indicating that changes in cytokine levels is associated with changes in microbiome composition.
This analysis of the 12 cytokines is interpretable. Of note is that microbiome composition, associated with obesity, differs in low leptin (subgroups 3, 5, 6) versus high leptin (subgroups 8, 9) suggesting leptin, obesity, and microbiome may be associated. As a testable hypothesis it was determined that N = 32 subjects in each of the low and high leptin groups would provide 80% power to detect a statistically significant difference in microbiome composition.
It is important to emphasize that we view Large P Small N data analyses as exploratory only. This leads to two results. First, the analysis is not limited to one subset. As many analyses as subsets of biologically meaningful variables can be done. These analyses can use any statistical method appropriate for the subset and not restricted to the same analysis across all subsets. Second, if the results indicate interesting biology they should be viewed as hypothesis generating and not as statistically significant. The researcher should confirm these results in follow-up designed experiments.
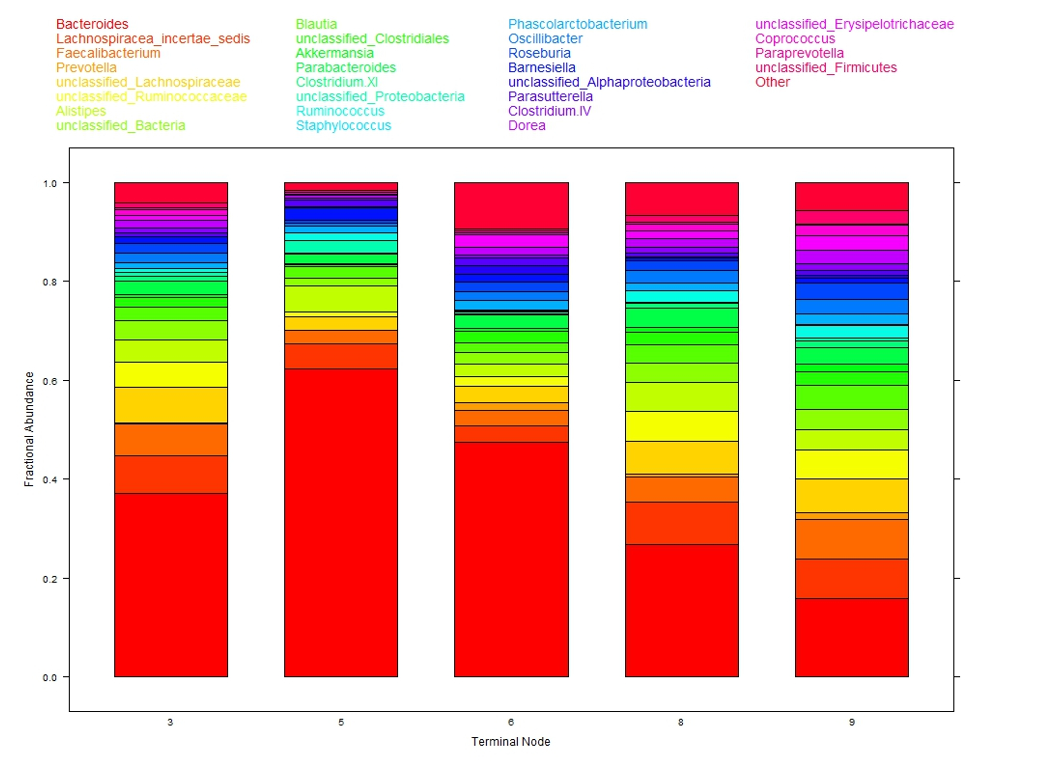
Figure 2: Taxa composition of samples within each of the five terminal nodes from DM-RPart
Do the Microbiome Genes Help Convert Healthy Patients to Pre-Diabetes?
In this analysis the question was whether the gut microbiome might influence a patient with normal insulin activity (insulin sensity) versus reduced insulin activity or pre-diabetes (insulin resistance). Subjects were fed a diet to increase their weight followed by a diet to reduce their weight. Microbiome, insulin status (sensitive/resistant), and several other phenotypes were measured on each patient at 4 time points throughout the study.
We modified an analysis used in ecology called RLQ[7] to answer this question. RLQ is the simultaneous analysis of the information contained in three tables:
- R (microbiome composition of samples)
- L (phenotype of samples)
- Q (bacterial gene copy numbers).
Figure 3 shows the RLQ data layout. The rows of tables L and R correspond to the subjects with the entries in L the taxa counts and the entries in R the values of the phenotypes (e.g., insulin sensitive or resistant). The columns of table L and Q correspond to the taxa with the entries in Q the copy number of each gene specified by the Q table row.
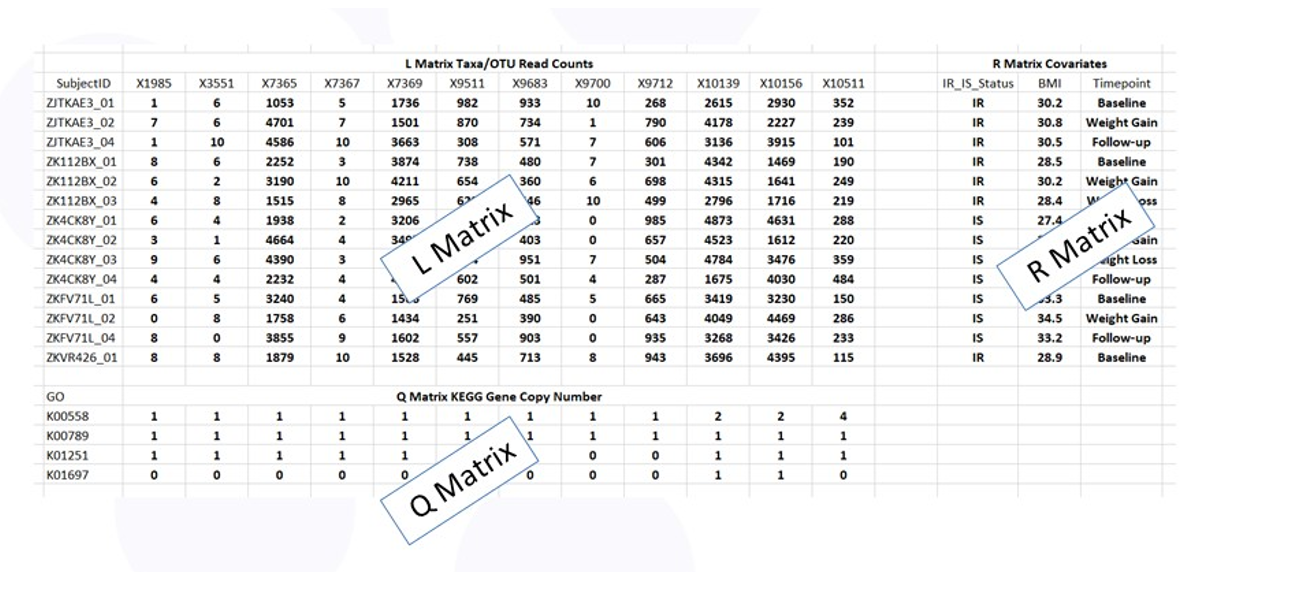
Figure 3: Data tables for RLQ analysis.
Since the gene sets within bacteria are large (they have to code for all the activities of the bacteria), there are thousands of bacterial genes in the microbiome that make the Q table very large and the analysis Large P Small N. It is therefore important to consider focused analyses on subsets of genes.
Figure 4 is the cysteine and methionine metabolism pathway from the KEGG database.[8] This pathway describes the synthesis and degradation of these two molecules and involves dozens of steps and genes. To reduce the data, we focused the analysis on the methionine degradation pathway shown by the red lines in the blue box. Methionine is degraded to L-Cystathionine, with the creation of the intermediate compound L-Homocysteine associated with vascular disease (Hyperhomocysteneimia), and possibly associated with diabetes. We limited the Q table to the 4 genes in the methionine degradation pathway thought to be associated with diabetes.
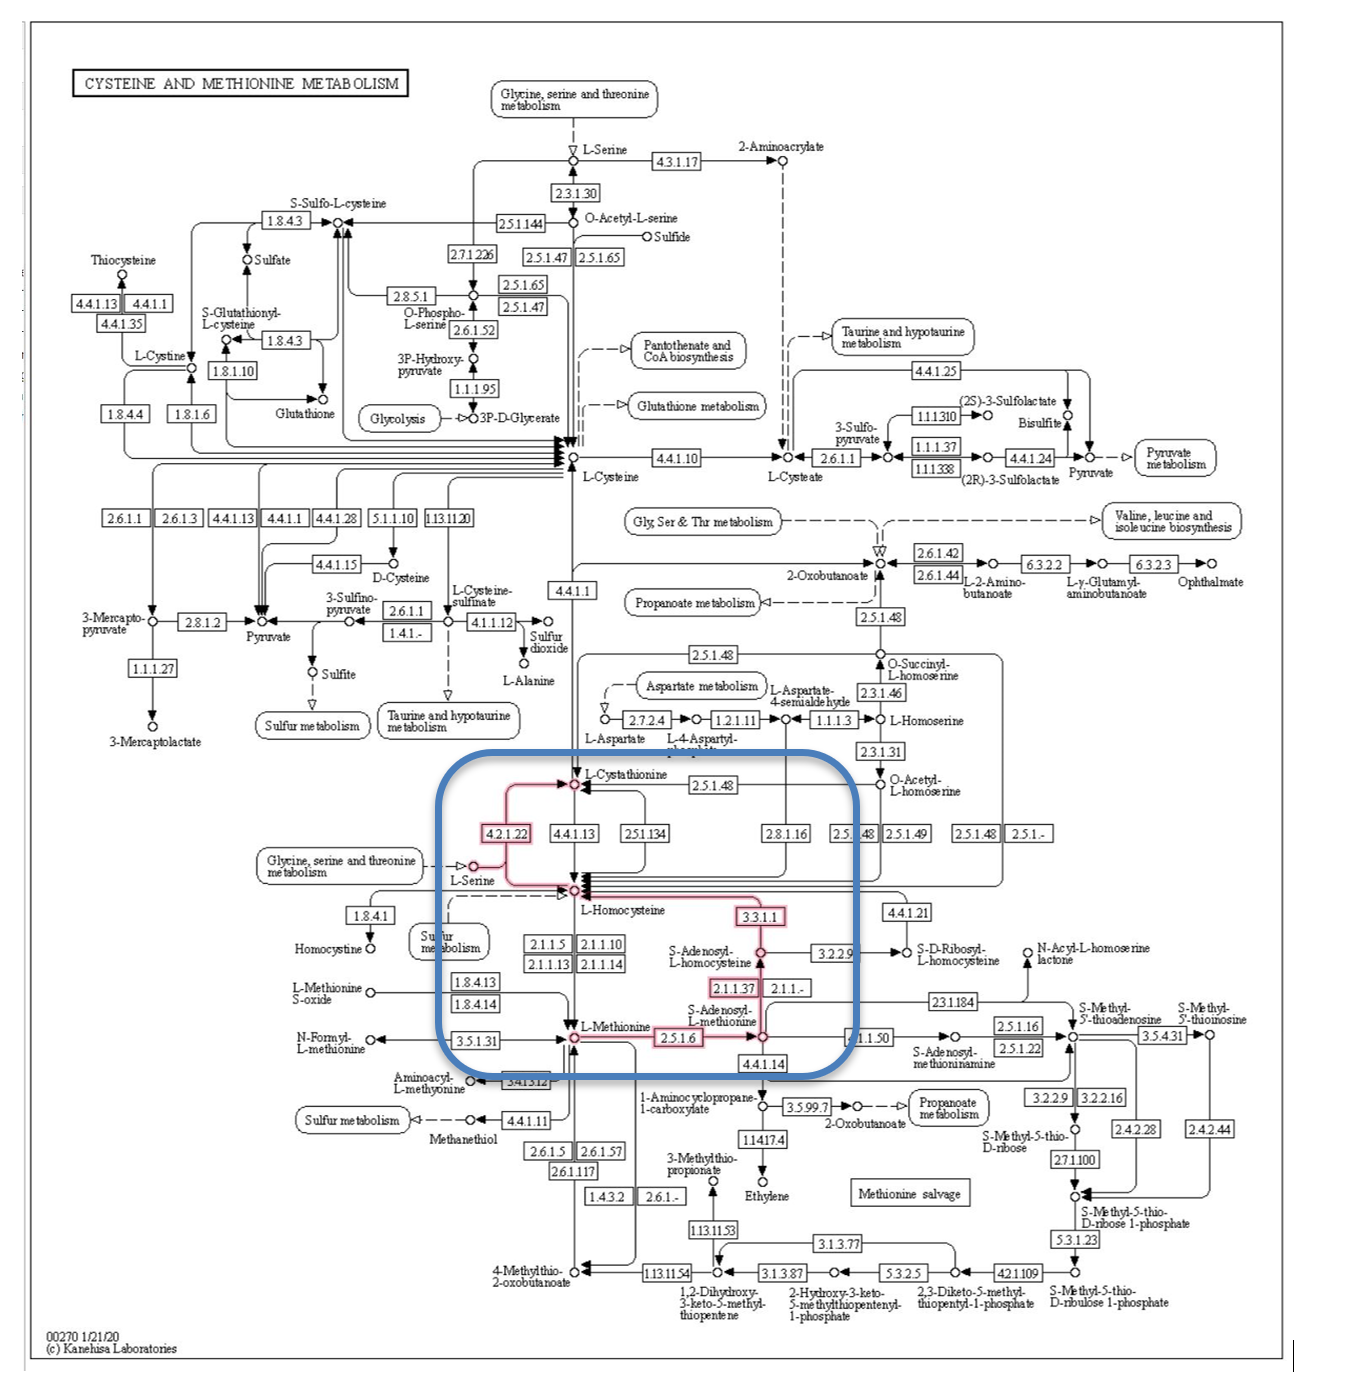
Figure 4: Methionine degradation pathway from KEGG database.
Figure 5 shows the RLQ analysis results. Genes K00558 (DNA (cytosine-5)-methyltransferase 1) and K01251 (adenosylhomocysteinase) are positively associated with insulin sensitivity (red lines connecting each to IR_IS.IS) and negatively associated with insulin resistance (blue lines connecting each to IR_IS.IR). Unassociated genes and traits are shown in green.
These results suggest the possibility that increasing the prevalence in the gut of taxa with high K00558 and K01251 gene copy numbers may slow or prevent conversion from insulin sensitivity to resistance, and therefore reduce conversion to diabetes. This is a testable hypothesis.
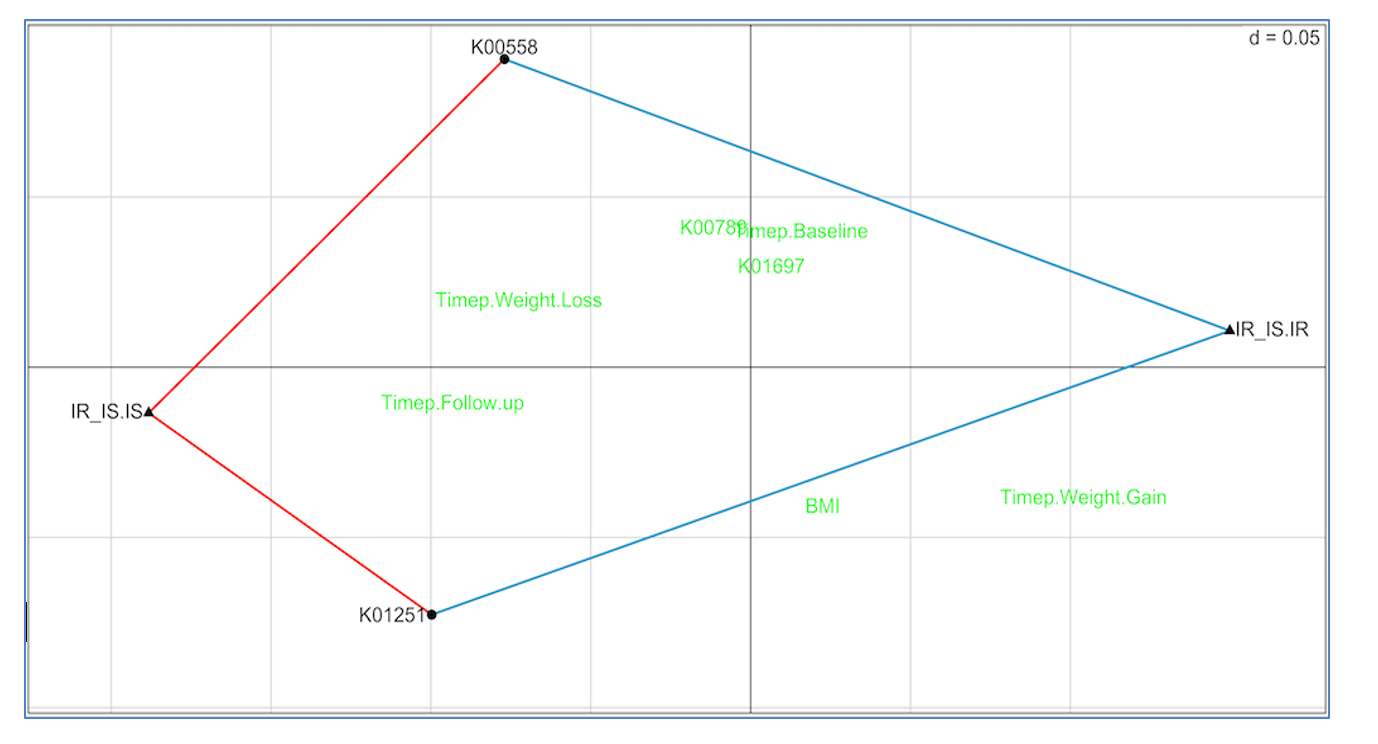
Figure 5: RLQ analysis of methionine pathway
As mentioned above, high throughput screening experiments are exploratory and a focused analysis on a reduced set of variables selected based on subject-area expertise, such as methionine degradation, does not prevent other analyses from being done. The nicotinate/nicotinamide degradation pathway is thought to be associated with insulin sensitivity and BMI and a focused RLQ analysis of the genes in this pathway is shown in Figure 6. More genes were found to be associated (positively and negatively) with insulin status, and one gene, K00763 positively associated with BMI – more copies of K00763 meant higher subject BMI. All of these are testable hypotheses.
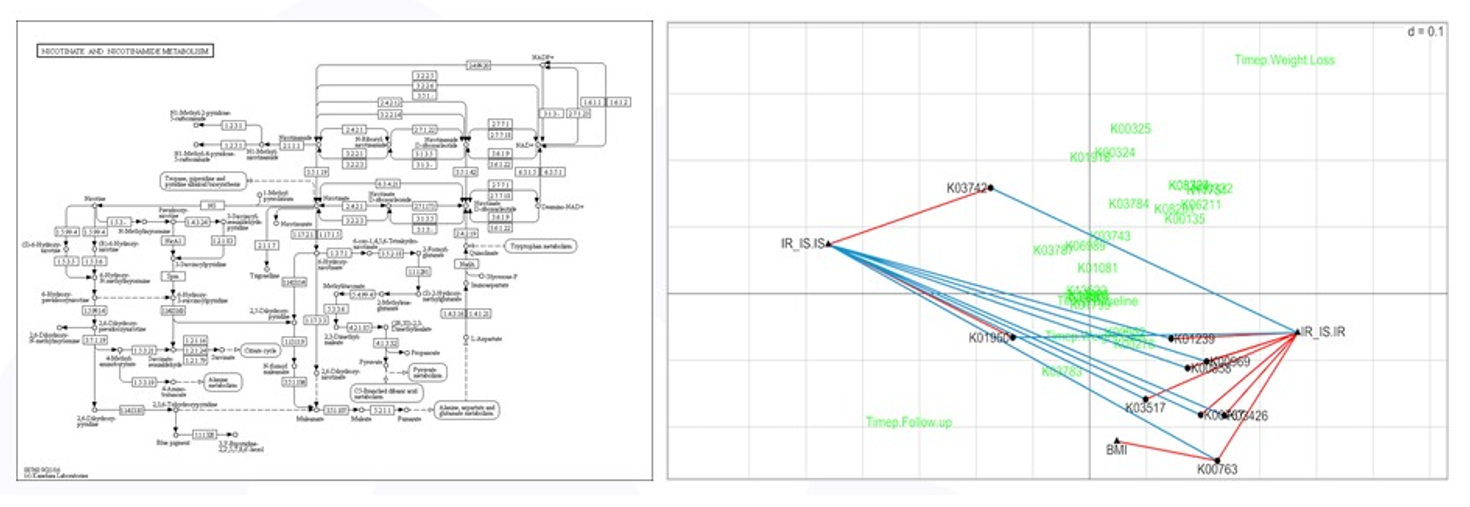
Figure 6: RLQ analysis of nicotinate pathway
Summary
Since most -omics studies are designed without a hypothesis – measure everything and see what comes out – treating the data analysis as exploratory is appropriate. Anything that is discovered in subset analyses should be viewed as hypothesis-generating and potentially testable.
By including biological knowledge into the analysis of multi-omics data understanding of biological mechanisms might be uncovered. We are moving these experiments from ‘measure everything and see what we can find’ to ‘we have measured everything now let’s specify interesting hypotheses and see if they hold up to scrutiny’.

References
- https://obgyn.onlinelibrary.wiley.com/doi/full/10.1576/toag.13.3.189.27672 ↑
- https://blog.dominodatalab.com/the-curse-of-dimensionality ↑
- https://www.nature.com/collections/fiabfcjbfj ↑
- https://www.nature.com/articles/s41598-019-56397-9 ↑
- https://cran.r-project.org/web/packages/rpart/vignettes/longintro.pdf ↑
- https://journals.plos.org/plosone/article?id=10.1371/journal.pone.0052078 ↑
- https://esajournals.onlinelibrary.wiley.com/doi/10.1890/03-0178 ↑
- https://www.genome.jp/kegg/kegg2.html ↑

Bill Shannon is the Co-Founder and Managing Partner of BioRankings. Bill has over 25 years of experience developing analytical methodology for complex and big data in biomedical R&D. In his capacity as a Professor of Biostatistics in Medicine at Washington University School of Medicine in St. Louis, Bill focused on statistical methods grants in emerging areas of medicine, and worked with researchers when there are no known statistical methods for analyzing their study data. Bill acts as a partner with clients and works to communicate results and their implications to both business executives and scientific researchers.
Other posts you might be interested in


Subscribe to the Domino Newsletter
Receive data science tips and tutorials from leading Data Science leaders, right to your inbox.
By submitting this form you agree to receive communications from Domino related to products and services in accordance with Domino's privacy policy and may opt-out at anytime.