Numenta Anomaly Benchmark: A Benchmark for Streaming Anomaly Detection
Subutai Ahmad2017-04-14 | 7 min read
With sensors invading our everyday lives, we are seeing an exponential increase in the availability of streaming, time-series data. Finding anomalies or unusual behavior in this data can be extremely valuable, but doing it reliably is quite difficult. There are dozens of anomaly detection algorithms in the literature but it is almost impossible to evaluate them for streaming because existing benchmarks focus on non-streaming batch data. We created the open source Numenta Anomaly Benchmark (NAB) to fill this hole[1]. NAB allowed us to test and improve our own algorithm[2], and also compare against other published algorithms.
The Problem
Streaming applications impose some special constraints and challenges for machine learning models. These applications involve analyzing a continuous sequence of data occurring in real time. In contrast to batch processing, the full dataset is not available. The system observes each data record in sequential order as they arrive and any processing or learning must be done in an online fashion.
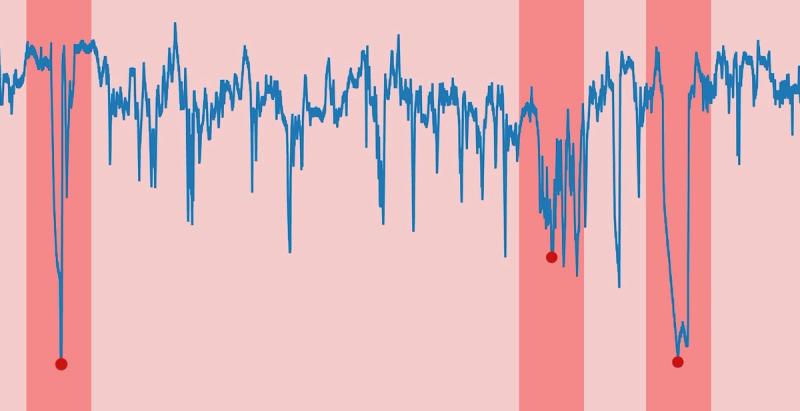
Take a look at Figure 1 below, an example of time-series data from a sensor. The plot shows scalar values over time for an unknown metric. Can you guess if the metric is blood glucose level for a diabetes patient, stock volume for a Fortune 500 company, or something else? It’s difficult to tell, yet it’s apparent the plot shows data anomalies, or deviations from the normal pattern.
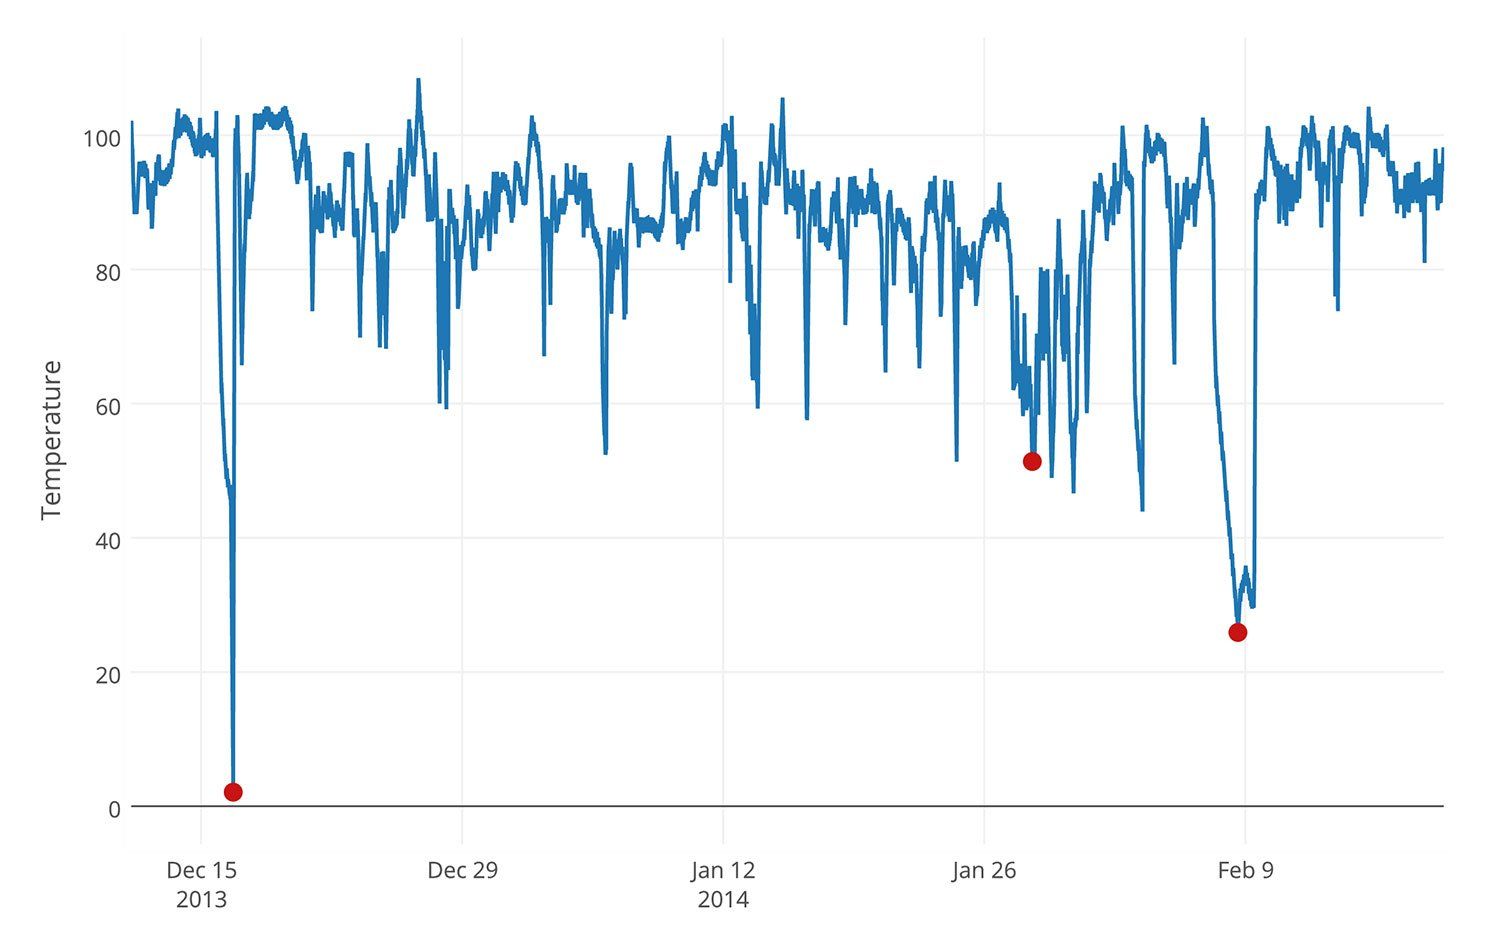
Figure 1: An example data file from the NAB corpus; data from monitoring the temperature of an internal component of a large, expensive, industrial machine. Red dots show actual anomalies. For details on these and other NAB components, please explore the NAB repository.
Looking at the entire plot, these anomalies are easily recognized after-the-fact but identifying anomalies long after they occur isn’t acceptable. A real-world anomaly detector has to process streaming data, learn continuously, and make accurate detections as soon as possible.
In NAB we define the ideal characteristics of a real-time anomaly detection algorithm as follows:
- Detections must be made online; i.e., the algorithm must identify the current state as normal or anomalous before seeing the future.
- The algorithm must learn continuously without a requirement to store the entire stream.
- The algorithm must run in an unsupervised, automated fashion—i.e., without data labels or manual parameter tweaking.
- The algorithm must adapt to dynamic environments and concept drift, as the underlying statistics of the data stream can change.
- The algorithm should detect anomalies as early as possible.
- The algorithm should minimize false positives and false negatives (this is true for batch scenarios as well).
NAB
NAB is a standard open source framework for evaluating real-time anomaly detection algorithms. NAB comprises two main components: a dataset with labeled, real-world time-series data, and a scoring system designed for streaming data. The dataset contains 58 labeled files (about 365,000 data points) from a variety of sources such as IT, industrial machine sensors, social media, etc. The scoring system is a twist on the typical false positive false negative metric. It rewards detectors that are accurate but also gives preference to those detectors that detect anomalies earlier than other algorithms.
In addition, the NAB repository now includes results from about ten different anomaly detection algorithms. Table 1 shows the latest NAB leaderboard (please see the repository for details).
Perfect | 100 | 100 | 100 |
|---|---|---|---|
HTM AL | 70.1 | 63.1 | 74.3 |
CAD OSE | 69.9 | 67.0 | 73.2 |
nab-comportex | 64.6 | 58.8 | 69.6 |
KNN-CAD | 58.0 | 43.4 | 64.8 |
Relative Entropy | 54.6 | 47.6 | 58.8 |
HTM PE | 53.6 | 34.2 | 61.9 |
Twitter ADVec | 47.1 | 33.6 | 53.5 |
Etsy Skyline | 35.7 | 27.1 | 44.5 |
Sliding Threshold | 30.7 | 12.1 | 38.3 |
Bayesian Changepoint | 17.7 | 3.2 | 32.2 |
EXPoSE | 16.4 | 3.2 | 26.9 |
Random | 11 | 1.2 | 19.5 |
Null | 0 | 0 | 0 |
Table 1. NAB scoreboard showing results of each algorithm on v1.0 of NAB.
Figure 2 shows two illustrative examples of running some of the detectors on one of the data files. The first one shows the value of continuous learning. The second one demonstrates early detection with temporal streams.
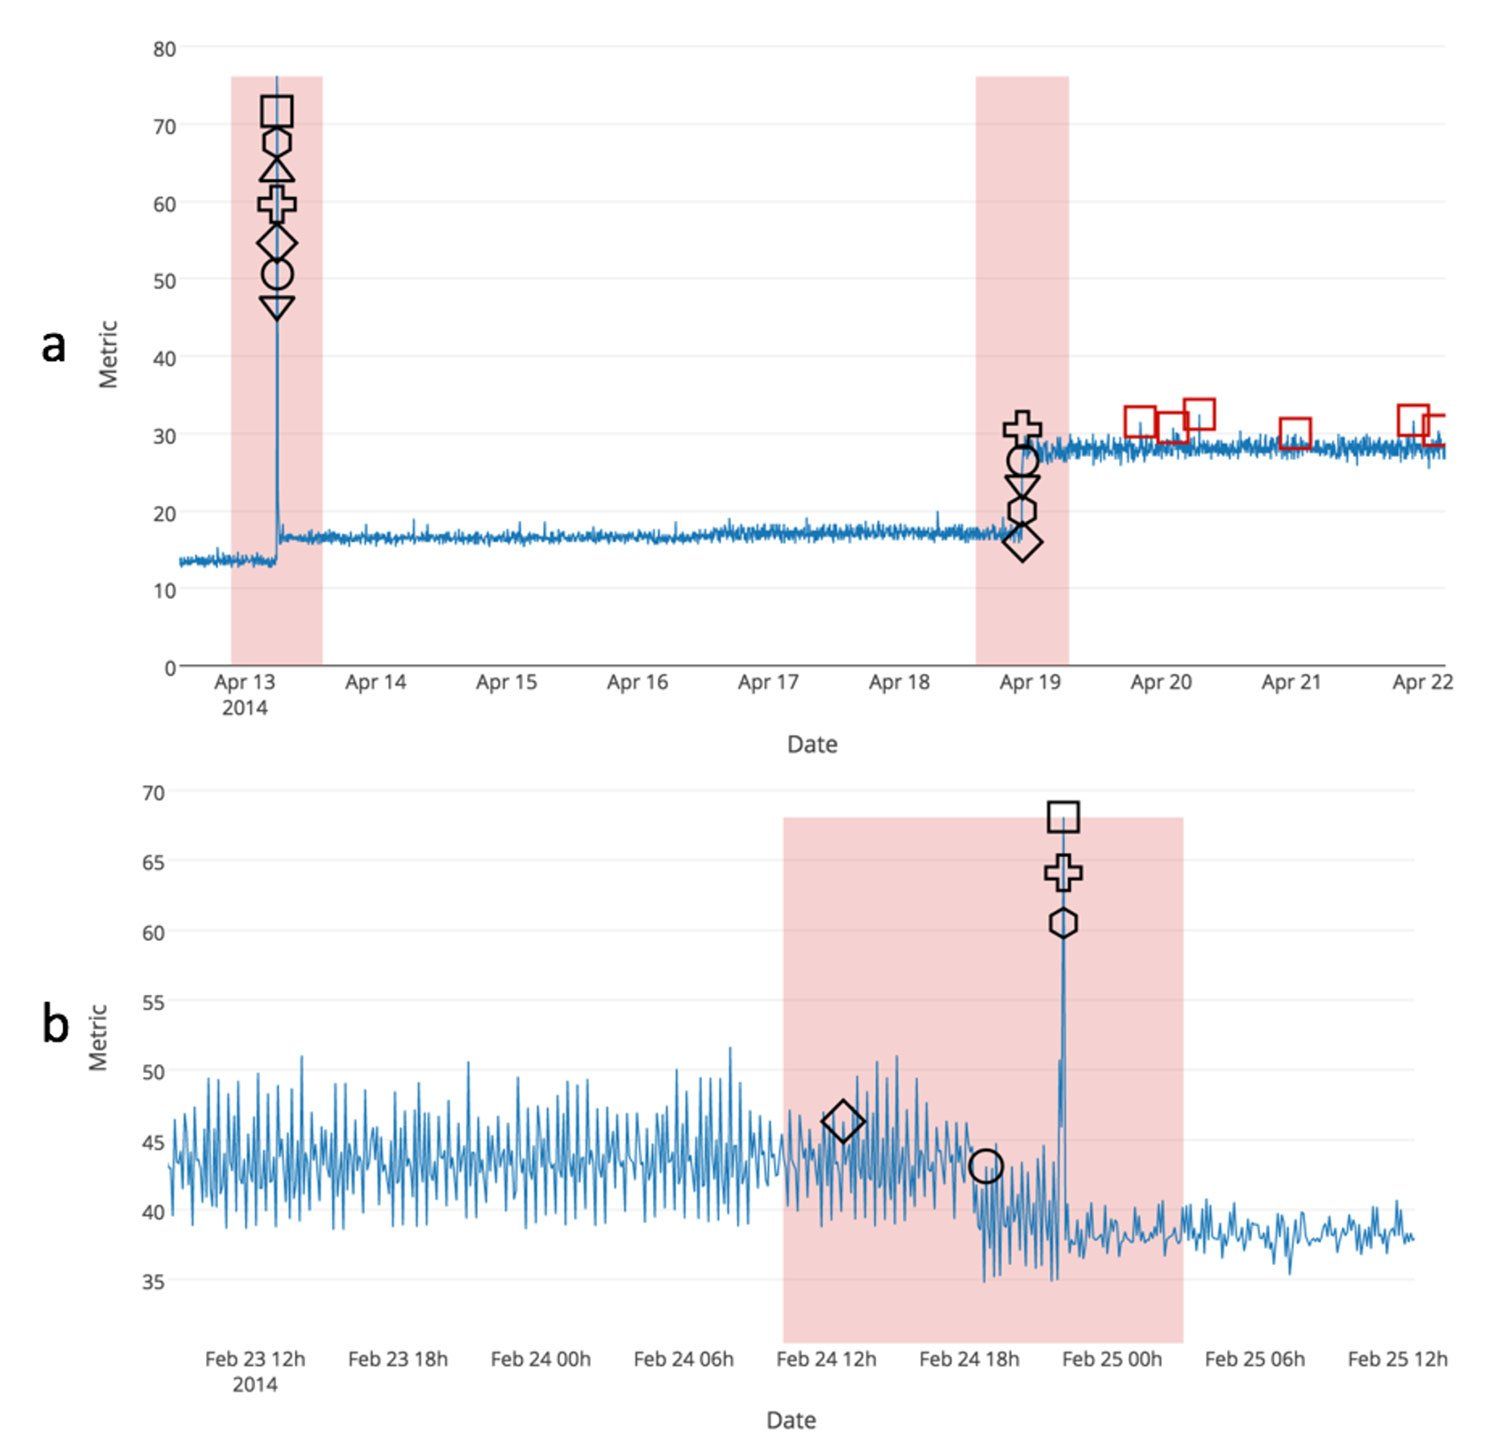
Figure 2: This plot shows detector results for two example NAB data streams. In both cases we show a subset of the full data stream. The plotted shapes correspond to the detections of seven different detectors: Numenta HTM (circle), Mutlinomial Relative Entropy (diamond), Twitter ADVec (square), Skyline (cross), sliding threshold (triangle-up), Bayesian Online Changepoint (hexagon), and EXPoSE (triangle-down). Shapes that correspond to the same data point have been spaced vertically for clarity. True positive detections within each window (red shaded regions) are labeled in black. All false positive detections are colored red. (a) Detection results for a production server’s CPU metric. The second anomaly shows a sustained shift that requires algorithms to adjust to a new normal behavior. (b) Results for a data stream where we see a subtle temporal anomaly that preceded a large, obvious spike in the data. Most detectors detected the large spike, but two were able to provide a more valuable early warning.
How We Use Domino
We used Domino extensively in the process of testing the various anomaly detection algorithms. For most machine learning algorithms there’s usually a large set of parameters that need to be tested. For each parameter combination we need to run that algorithm on the entire corpus. The cross product of all of the algorithms and all of the parameters was a pretty large space. Domino allowed us to explore that space very easily in the cloud in parallel, and track all the results. Figure 3 shows a sample screenshot where we ran four different algorithms in parallel. Parameter tuning that would normally have taken days per algorithm instead took us hours.
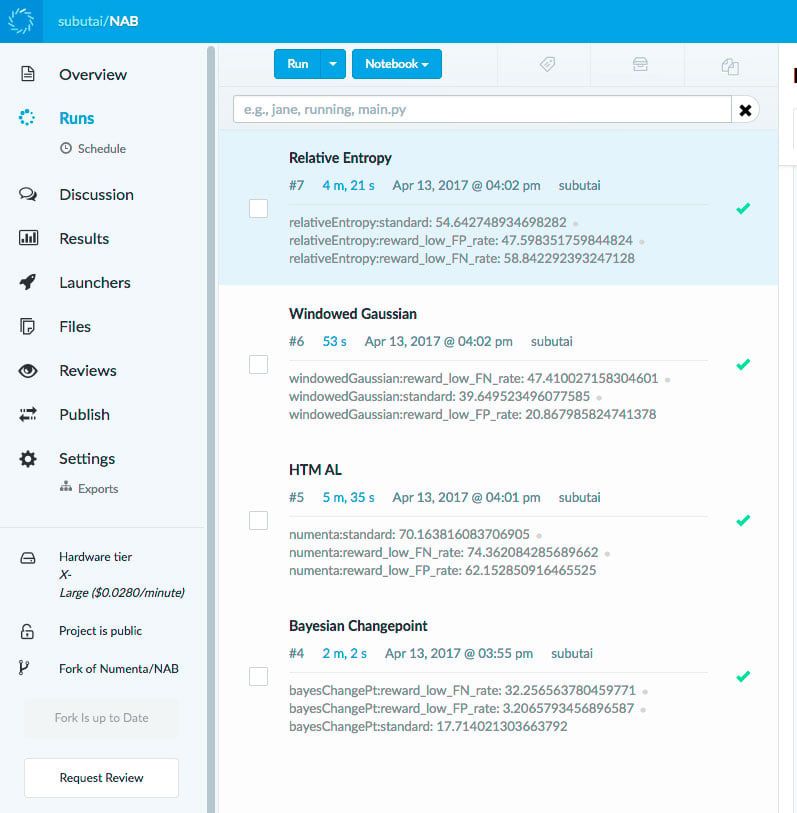
Figure 3: This screenshot shows an example of using Domino with NAB. We were able to easily run multiple algorithms in parallel. We used the X-Large hardware tier so that each run could use 16 cores at a time. We used Domino’s Diagnostic Statistics feature to view the result of each run in a single notebook.
The code for many of the above algorithms is also available in the repository, so it is easy for developers to replicate the results and try out the various detectors on their own data. Over time, we hope NAB will prove to be a valuable open resource for data scientists working on streaming anomaly detection.
References
- Lavin A, Ahmad S. Evaluating Real-time Anomaly Detection Algorithms – the Numenta Anomaly Benchmark. 14th Int. Conf. Mach. Learn. Appl. (IEEE ICMLA’15). Miami, Florida: IEEE; 2015. Available from: http://arxiv.org/abs/1510.03336
- Ahmad S, Purdy S. Real-Time Anomaly Detection for Streaming Analytics. 2016; Available from: http://arxiv.org/abs/1607.02480
Subutai Ahmad is a researcher in computational neuroscience and machine learning, and a software technologist living in Palo Alto. Currently, he is the VP, Research at Numenta, a technology company focused on developing a cohesive theory, core software technology, and numerous applications all based on principles of the neocortex.
SHARE
Other posts you might be interested in


Subscribe to the Domino Newsletter
Receive data science tips and tutorials from leading Data Science leaders, right to your inbox.
By submitting this form you agree to receive communications from Domino related to products and services in accordance with Domino's privacy policy and may opt-out at anytime.