Measuring A Data Science Team's Business Value & Success
Kimberly Shenk2017-07-31 | 9 min read

This blog post covers metrics that help data science leaders ensure their team’s work is aligned to business value.
Data science managers and executives, whether coming up through the technical side or the manager side, all struggle with providing visibility for their team and how the team's work is aligned to business value. It is hard to proactively manage your team and their interactions with the business. You usually learn too late that a project delivered an irrelevant finding or that the business already made the decision because the work wasn’t delivered fast enough. In this blog post, I provide metrics that help data science leaders ensure their team’s work is aligned to business value. These metrics are based on what I have learned from leading and building data science teams and nuggets from my colleagues.
Why metrics help
Just as any other department uses operational metrics to measure the efficiency and effectiveness of their organizations, data science needs to do the same. Sales teams use funnel metrics to measure how effectively their teams are converting prospects down the funnel to closed-won. Engineering teams use sprint burndown and team velocity to measure how efficiently their teams complete work in a given amount of time. Monitoring leading indicators allow these teams to quickly adjust before a revenue number is missed or a product feature is delayed.
For data science teams, it is important to identify critical information like when a data scientist is spending precious hours reproducing something someone else has already done. Or when a business stakeholder has not been looped in to give feedback on a project before it is delivered as “done”. Leading indicators are a useful tool that I have used to get in front of the work my teams were producing throughout the data science lifecycle.
Nontraditional metrics for the data science lifecycle
Just as sales metrics are built to measure and track the different phases of the sales funnel, data science metrics should measure and track the different phases of the data science lifecycle. But unlike the linear flow of the sales funnel, the data science lifecycle can follow a very non-linear path. This means you cannot use traditional metrics that track conversion from one phase to another. So it is important to know what behaviors you are trying to drive in your team and how that maps to the lifecycle any data science project will go through:
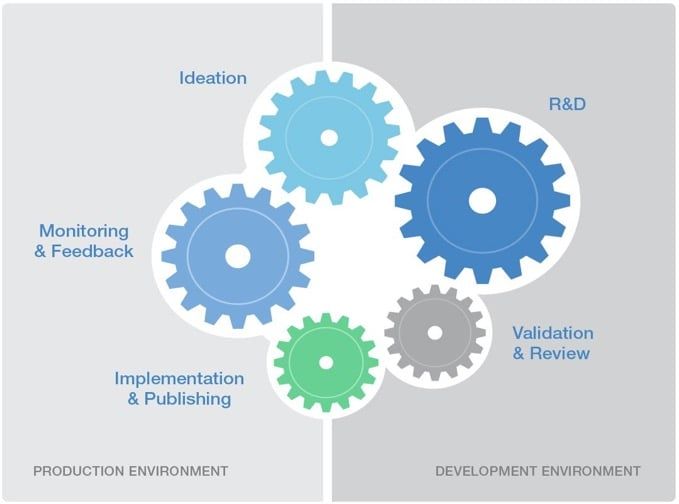
You can use this lifecycle as a framework to define important touchpoints and activities to track. Then, based on our team’s goals, craft actionable metrics that allow you to course correct early and learn to improve the way your team operates.
Three Types of Metrics
Selecting the right KPIs for your team should start from a clear identification of your team’s goals. In my experience managing data science teams, there are three primary goals behind measuring the output of your data science organization: managing the productivity and visibility of the team; managing the productivity and visibility of individuals; and reporting out the team’s contribution to business value.
Manage productivity and visibility at the team level
Managing the productivity and success of your data science team relies heavily on the insight you have into the projects the team is working on. This means gaining visibility into where projects are in the data science lifecycle, the types of activities being done in each project over time, and the collaboration between team members and stakeholders. Your KPIs should help you measure the quality and rateof insights being produced.
Measure the quality of insights being produced
You need to have leading indicators that help you to detect problems early, re-vector the direction of a project based on new learnings or changing business needs, or iterate quickly based on feedback. The credibility of your team is dependent on the caliber and usefulness of work you deliver to the organization. Here are a few suggestions:
| Metric | How To Use It |
|---|---|---|
Quality | # of projects that are reusing work that already exists | Is the team collaborating and re-using existing high quality work? Prevent someone from re-inventing the wheel. |
# of reviews made by team members per active project | Are code reviews and feedback happening in your team? Know who needs more feedback and who is not contributing feedback. | |
# of reviews made by stakeholders per active project | How many stakeholders check-ins have occurred in this project? Get more input from the business early and prevent things from going down the wrong path. |
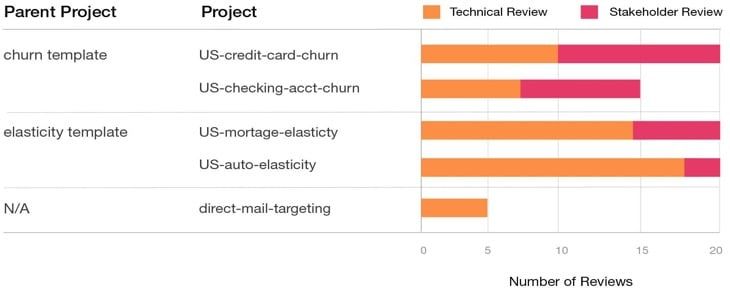
In the example below you can see a list of active projects, the existing parent project they were built from, as well as the number and different types of reviews that have been made on each project. In this case, when I see the new project direct-mail-targeting did not branch from an existing parent project, I would proactively investigate why that project was not reusing existing work. Or, I can see that no stakeholders reviews have occurred on that project. This allows me to potentially save the data scientist a lot of time by getting early feedback while also ensuring they are leveraging quality work we have already produced.
Measure the rate of insights being produced
These metrics should help you optimize the way your team works so that you deliver results to the business faster. This means not missing out on driving impact because the business has already moved on. Or also, expanding the breadth of your impact because you are able to get more insights out into the business faster. Here are a few suggestions:
| Metric | How To Use It |
|---|---|---|
Rate | # projects by expected delivery date | When do you expect to deliver work or milestones to the business? Make sure you have not over or under committed your team. |
# projects not assigned | How big is the backlog that the business is waiting on? Have we reached capacity? Make sure that by the time you plan to work on something important, it hasn’t become irrelevant. | |
# data scientists in each phase of the lifecycle and amount of time in each phase | Do I see a lot of my team stuck in the experimentation phase? Proactively unblock projects that have been in a certain phase for too long. |
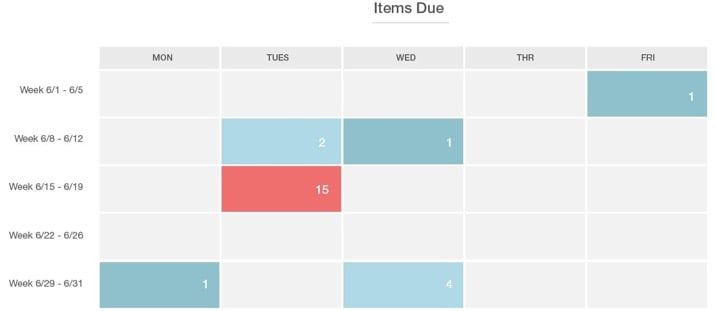
In the example below, you can see that the team is potentially over-committed to deliver work on Tuesday in week 6/15. From this I can drill in further to learn what the work is (e.g. is it just a milestone check-in or is it a final product), who on the team is working on it, and who in the business is depending on the work so that I can effectively re-prioritize and shift work around. I can also see that delivery is light in week 6/22 and figure out what is preventing us from having touchpoints or delivering iterations to the business during that week.
Manage productivity and visibility at the individual level
Projects and the work of your data science team will not be successful if individuals are not operating efficiently. You don’t want your data scientist going off into a back room to not surface for a couple of months. Manage the team’s work with visibility into the types of activities being done by each team member over time. This will make standups and status updates much more productive with less time talking about what is being worked on and more time addressing the meat of how to solve the problem. Here are a few suggestions:
| Metric | How To Use It |
|---|---|---|
Team Status | # projects actively being worked on per team member over time | How much is each team member producing and how does that trend over time? Know who needs more coaching on how to get them contributing on the same level as the rest of the team. |
# new comments per team member | Who is collaborating the most with the team and helping to uplevel the quality bar? Coach those who aren’t contributing or helping others. | |
# newly published artifacts per team member | Who is getting deliverables out to the business? Drive your team to get their work published for stakeholders to use. |
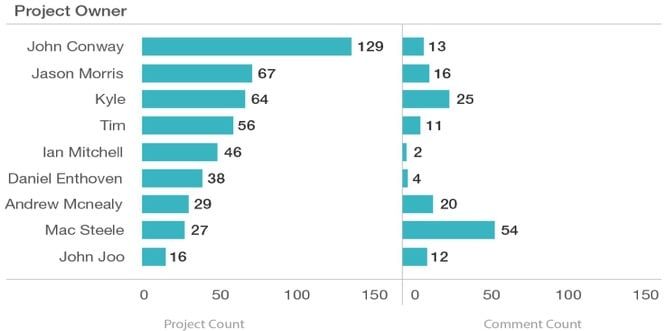
In this example, I have visibility into the number of active projects each person on my team has worked on in the past month. I can also see who is most actively contributing and collaborating with other team member’s based on their comment history. Comparing these numbers side by side and across the team helps me actively manage productivity and address potential problems early. For example, Mac may not have a lot of active projects but his contribution to the team has been extremely high. On the other hand, John Joo has contributed very little to the team and to project work and so this would be an opportunity to dig deeper and learn what is going on.
Report out alignment of your team’s work to business objectives
One of the most important jobs of a data science leader is to report out the value that the data science team is driving for the business. Measuring the ROI of your team’s work is very hard. The first step is to get visibility into what artifacts that have been published by your team are actively being used by different stakeholders across the business. In addition to measuring the returns, it is almost as important to provide visibility into your team’s use of resources. These kinds of measurements will help you provide meaningful updates to senior leadership that showcase the value your team is delivering to the business and better help your CIO/ DevOps support your team. Here are a few suggestions:
| Metric | How To Use It |
|---|---|---|
Report To Leadership | # published artifacts by department or Line of Business | What is your breadth of contribution across the business? Who is benefiting from your team’s work? |
Movement of success metrics/ KPIs the project is tied to | Baseline measure of the KPI the project is impacting vs expected/actual lift in KPI | |
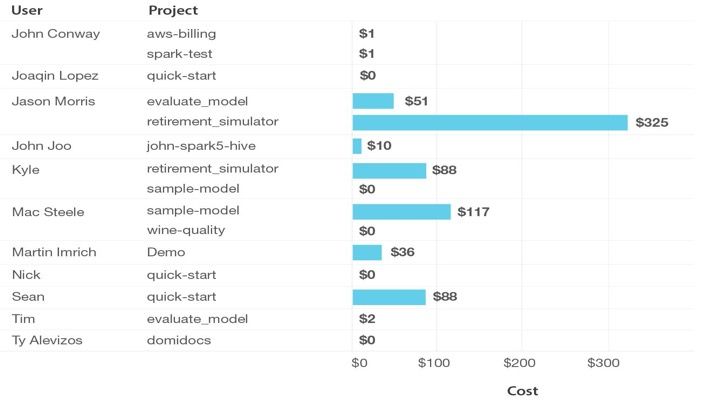
Resource usage and cost per day | Who is consuming the most resources? What business projects are the most expensive? Attribute costs back to users or teams to implement cost control strategies. |
In this example, I can facilitate transparency with my DevOps team by tracking the resources my team is consuming, who on the team consumes the most, and what projects for the business are driving these costs. This information can help them to implement intelligent cost control strategies and more accurately forecast.
Data science leaders are under increasing pressure to provide evidence that their teams’ work provides business value. Yes, it is hard, but it is not impossible. The metrics covered in this blog post are a good starting point for measuring how effective your data science team is and how much it is contributing to the organization. Tracking the team’s productivity, visibility as well as reporting out the value of the work is time consuming, but the gains are tremendous.


Subscribe to the Domino Newsletter
Receive data science tips and tutorials from leading Data Science leaders, right to your inbox.
By submitting this form you agree to receive communications from Domino related to products and services in accordance with Domino's privacy policy and may opt-out at anytime.